GeoLite2-City heap after open · process RSS after open 3.4 MiB → 64.6 MiB
All values come from x86_64/performance-comparison-data/summary.json. Speedup = After / Before median throughput; change = (speedup − 1) × 100; latency reduction = (1 − After / Before) × 100. Hover or focus any bar, candle or cell for exact values; every value is also in the tables below.
Benchmark lab / Before–After comparison
libmaxminddb lookups, measured on Neoverse-N2
Before 88ad5f46d9c884fc4a8533374b457cb9e3ee121f (upstream main) versus After fd08b229052ae34e9f2c3c3df4f64ed9d43f4347 (three commits: specialized packed traversal, allocation-free short MMDB_get_value() paths, then automatic radix-16 preparation with aligned native child records). Same harness source, identical compiler flags, static libraries, 180 measured runs and 1.80 billion measured lookups.
CPU Neoverse-N2Architecture AArch64Cores 4 / 4 threadsOS Ubuntu 24.04.5 LTS · Linux 7.0.0-1017-azureCompiler GCC 13.3.0 -O3 -DNDEBUGRepetitions 5 per configuration, alternating orderRecorded 2026-10-31T12:13:39+00:00
GeoLite2-City throughput
×1.75
+75.2% geometric mean of 12 configurations · 95% CI ×1.69–1.76 · 12 faster, 0 slower, 0 inconclusive
GeoLite2-City heap after open · process RSS after open 3.0 MiB → 64.2 MiB
All values come from aarch64/performance-comparison-data/summary.json. Speedup = After / Before median throughput; change = (speedup − 1) × 100; latency reduction = (1 − After / Before) × 100. Hover or focus any bar, candle or cell for exact values; every value is also in the tables below.
Throughput at 10M queries
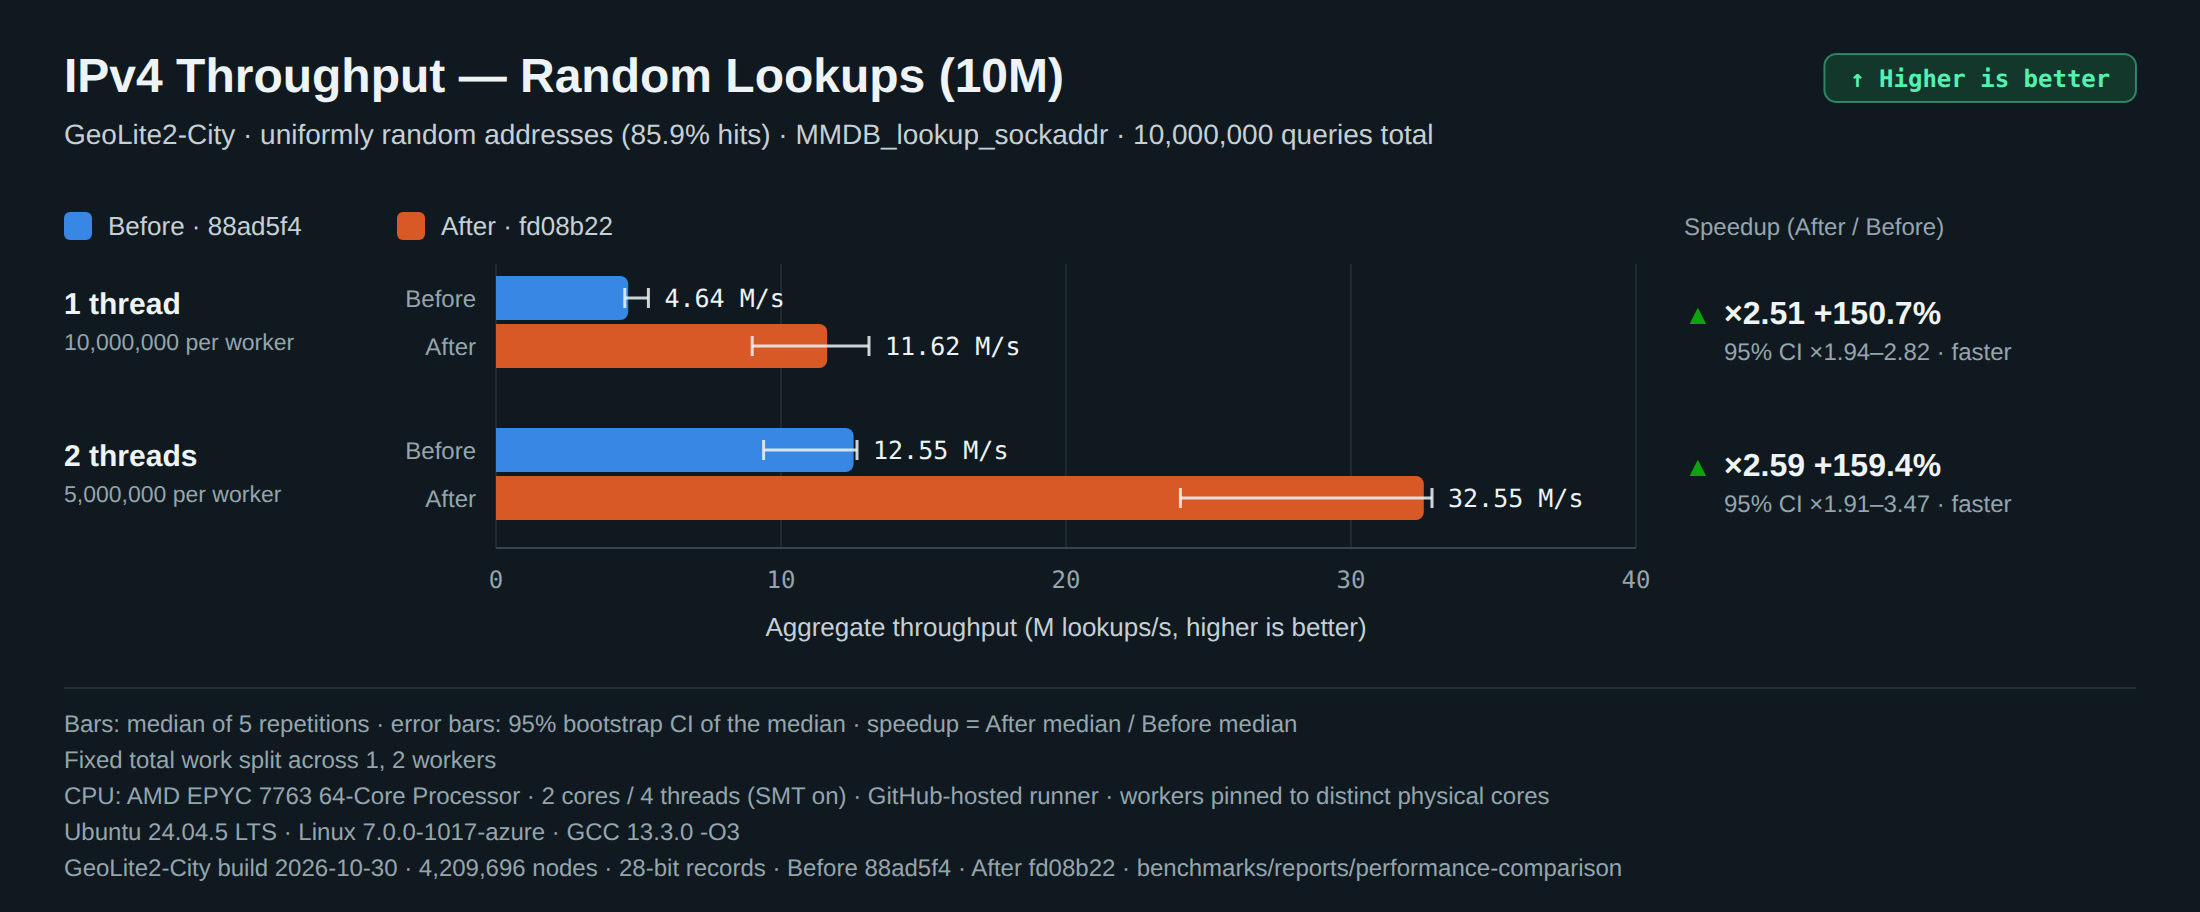
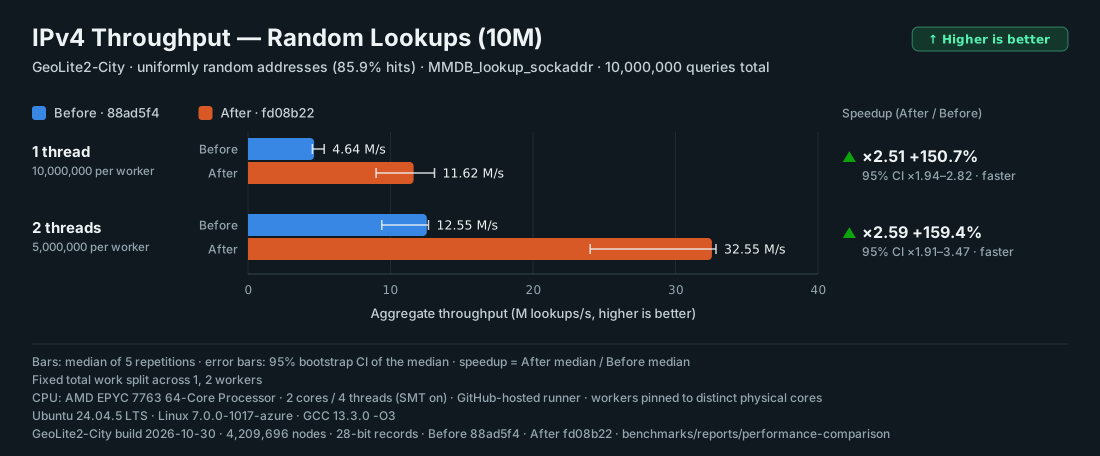
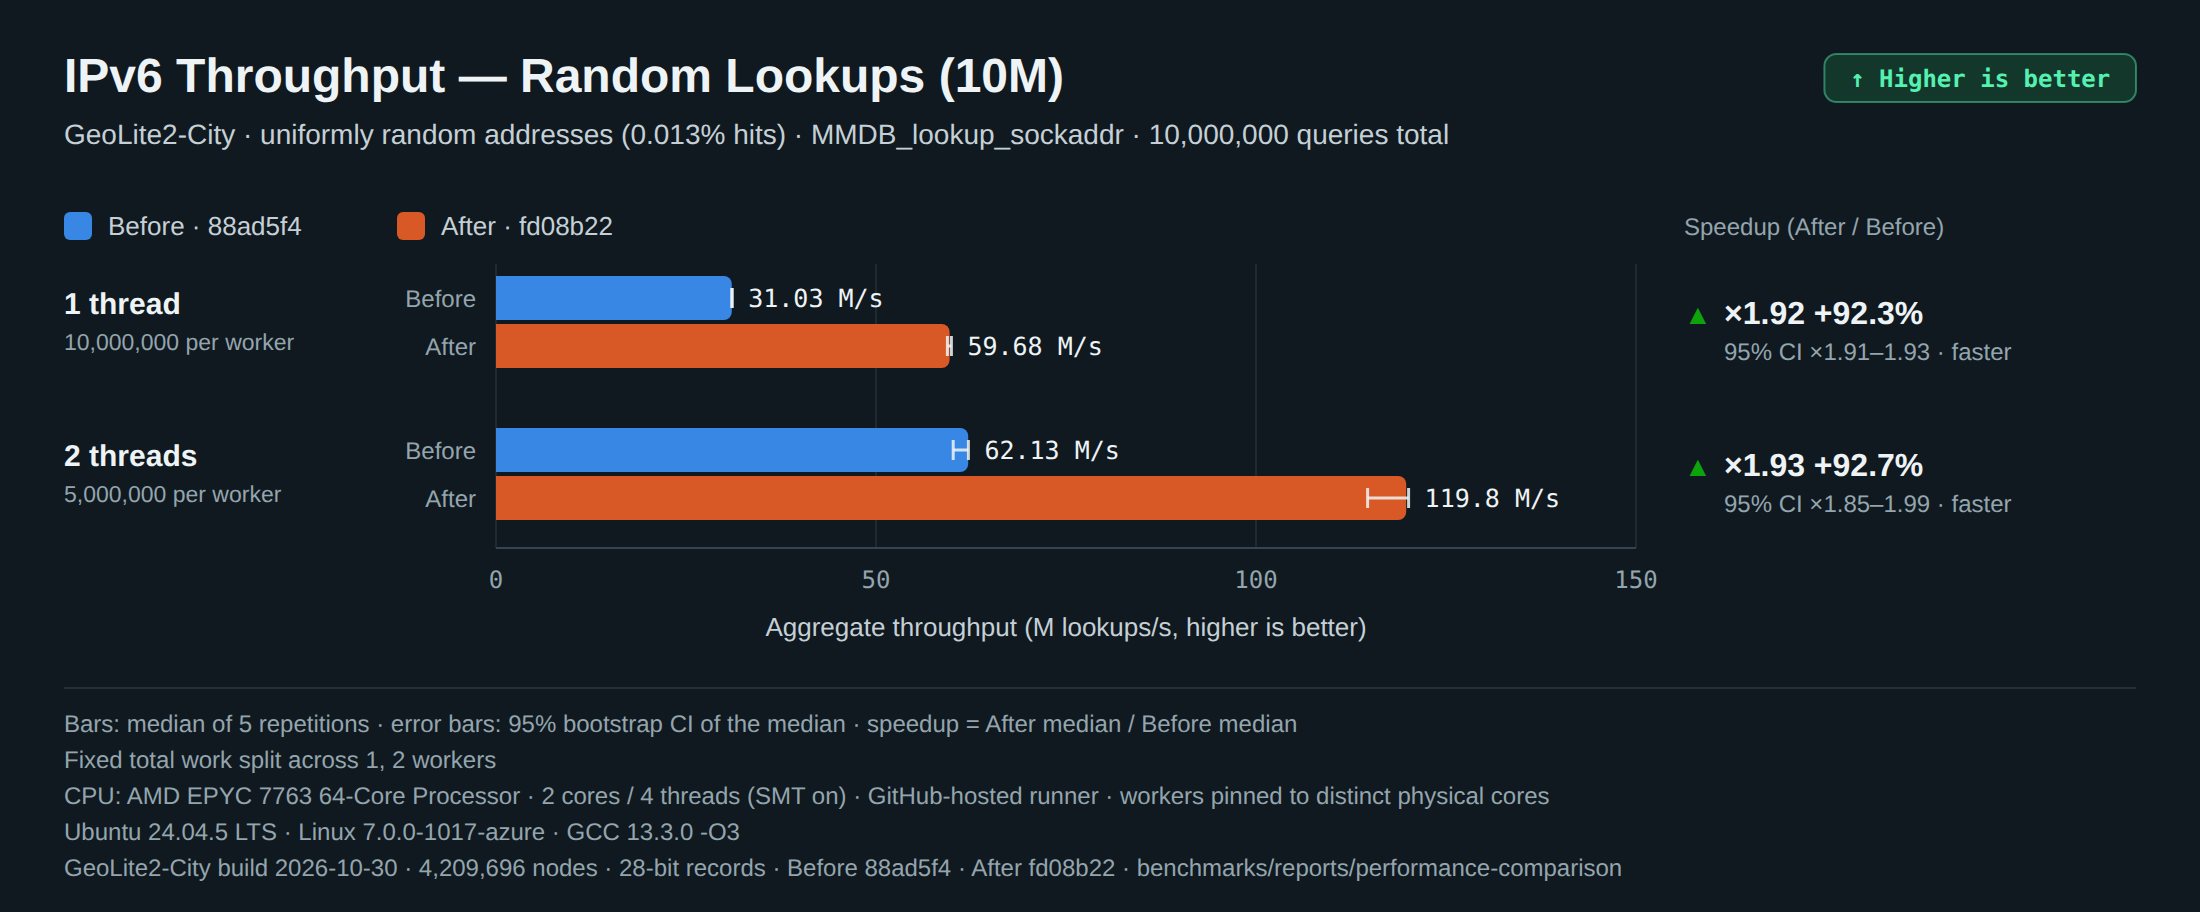
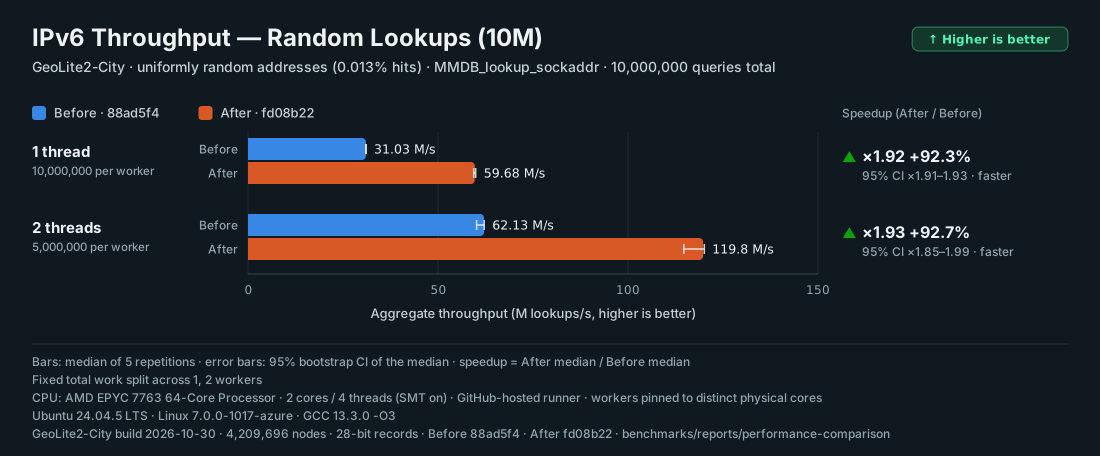
Total work is fixed: 1 worker performs 10,000,000 lookups, 2 workers 5,000,000 each.
IPv4 Throughput — Random Lookups (10M)
GeoLite2-City · uniformly random addresses (85.9% hits) · MMDB_lookup_sockaddr · 10,000,000 queries in total, split across 1 and 2 pinned workers · median of 5 runs, 95% bootstrap CI
IPv4 Throughput — Random Lookups + Field Decode (10M)
GeoLite2-City · uniformly random addresses (85.9% hits) · MMDB_lookup_sockaddr + MMDB_get_value(country → iso_code) · 10,000,000 queries in total, split across 1 and 2 pinned workers · median of 5 runs, 95% bootstrap CI
IPv6 Throughput — Random Lookups (10M)
GeoLite2-City · uniformly random addresses (0.013% hits) · MMDB_lookup_sockaddr · 10,000,000 queries in total, split across 1 and 2 pinned workers · median of 5 runs, 95% bootstrap CI
IPv6 Throughput — Random Lookups + Field Decode (10M)
GeoLite2-City · uniformly random addresses (0.013% hits) · MMDB_lookup_sockaddr + MMDB_get_value(country → iso_code) · 10,000,000 queries in total, split across 1 and 2 pinned workers · median of 5 runs, 95% bootstrap CI
Latency distribution
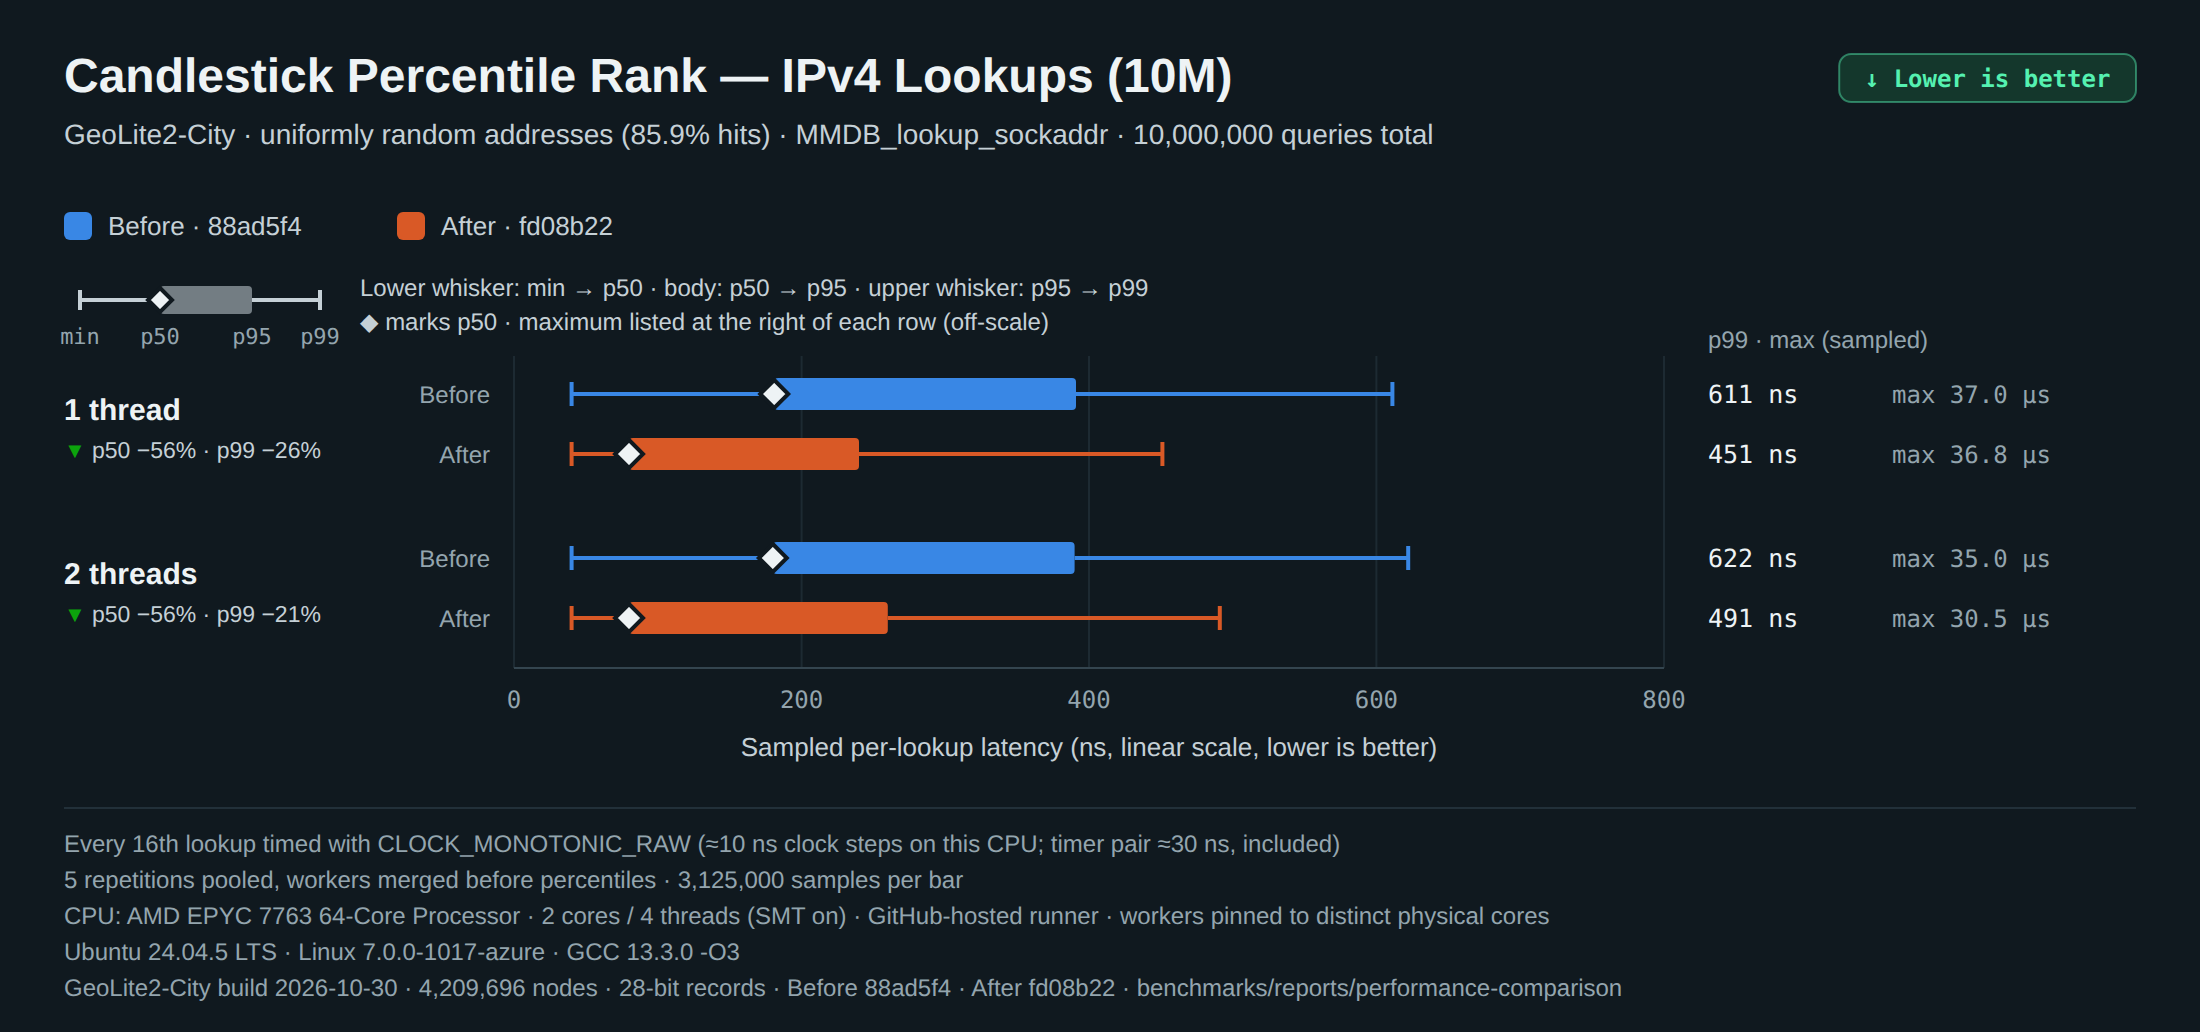
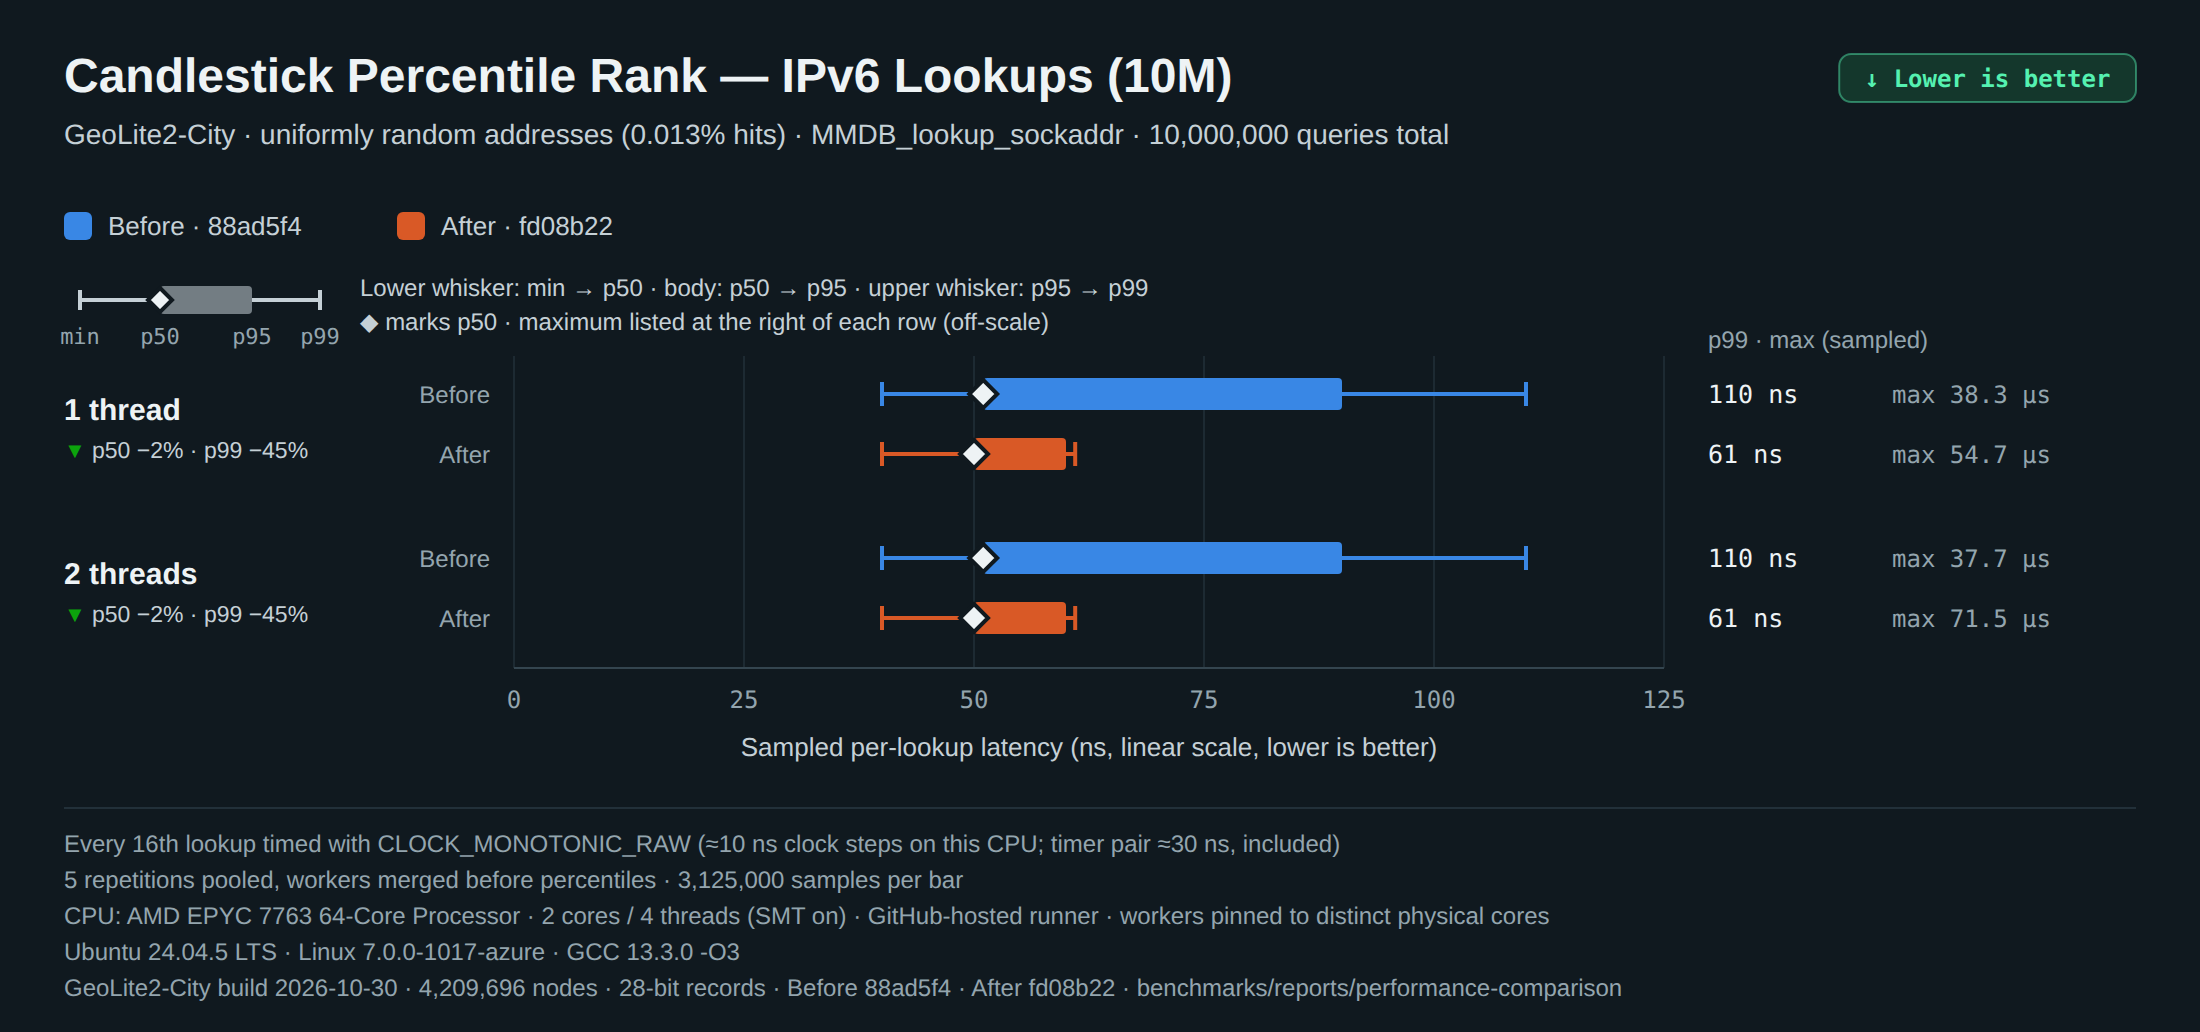
Separate latency campaign: one actual operation in every 16 is timed individually; workers are merged and repetitions pooled before percentiles are computed. Lower whisker min → p50, body p50 → p95, upper whisker p95 → p99, ◆ p50; the maximum is listed at the right of each row and in tooltips.
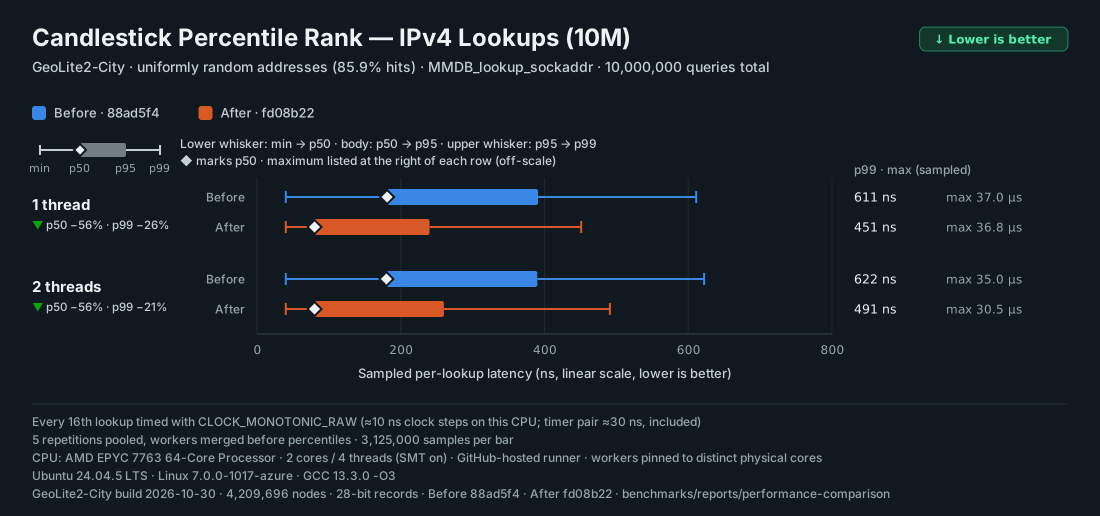
Candlestick Percentile Rank — IPv4 Lookups (10M)
GeoLite2-City · uniformly random addresses (85.9% hits) · MMDB_lookup_sockaddr · 10,000,000 queries in total · pooled samples of 5 repetitions per bar
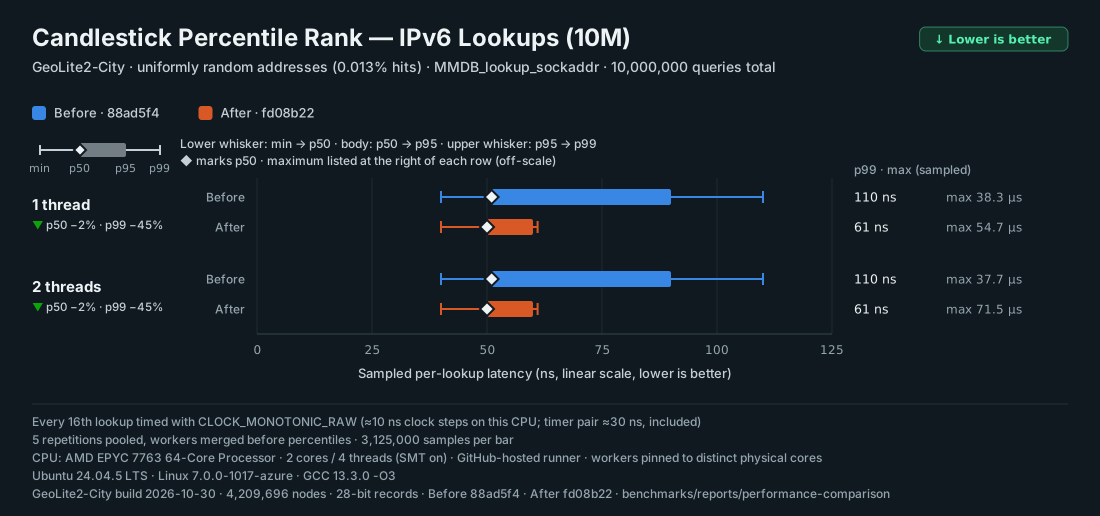
Candlestick Percentile Rank — IPv6 Lookups (10M)
GeoLite2-City · uniformly random addresses (0.013% hits) · MMDB_lookup_sockaddr · 10,000,000 queries in total · pooled samples of 5 repetitions per bar
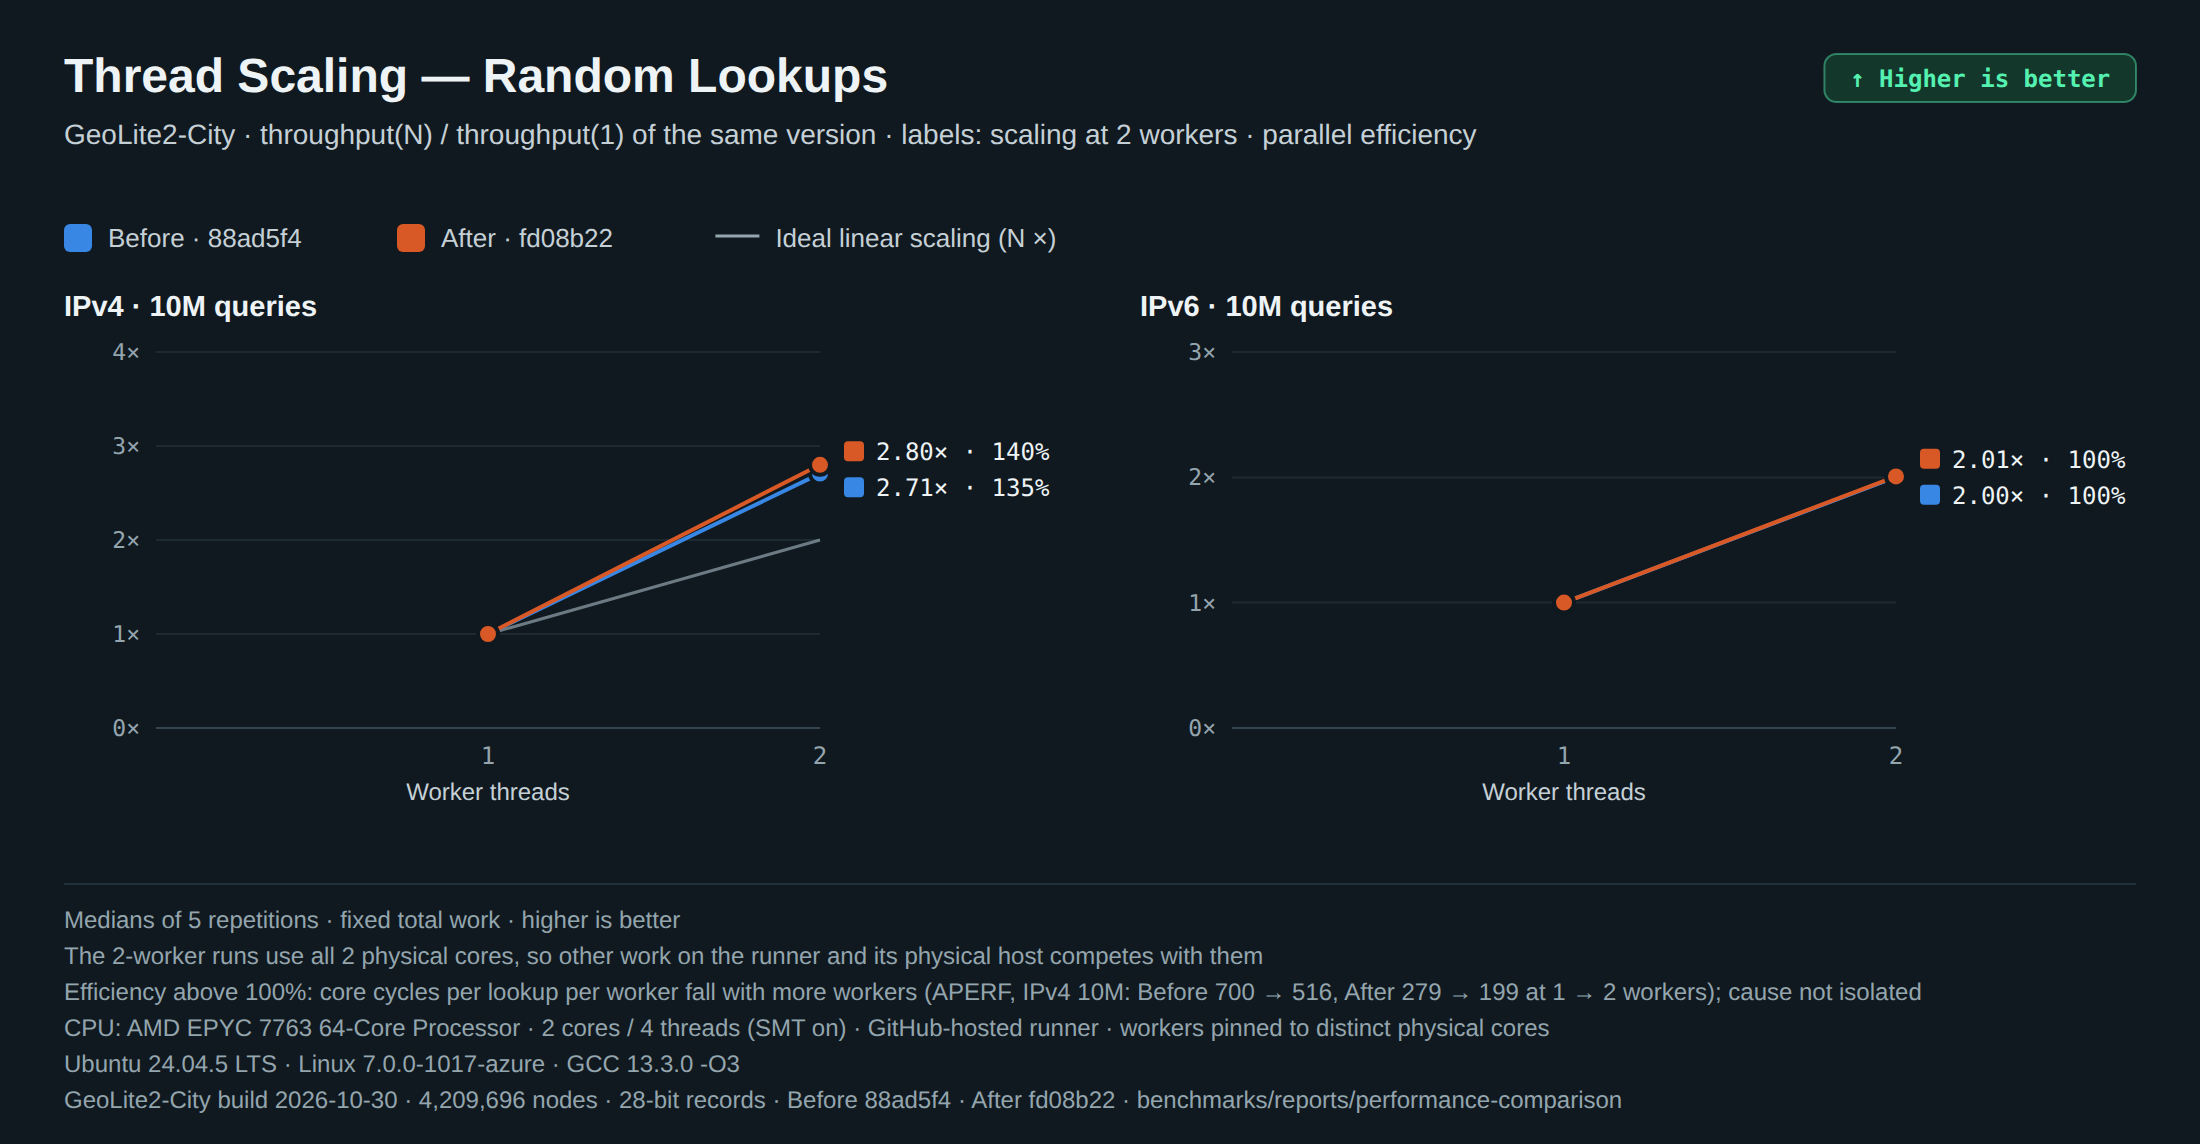
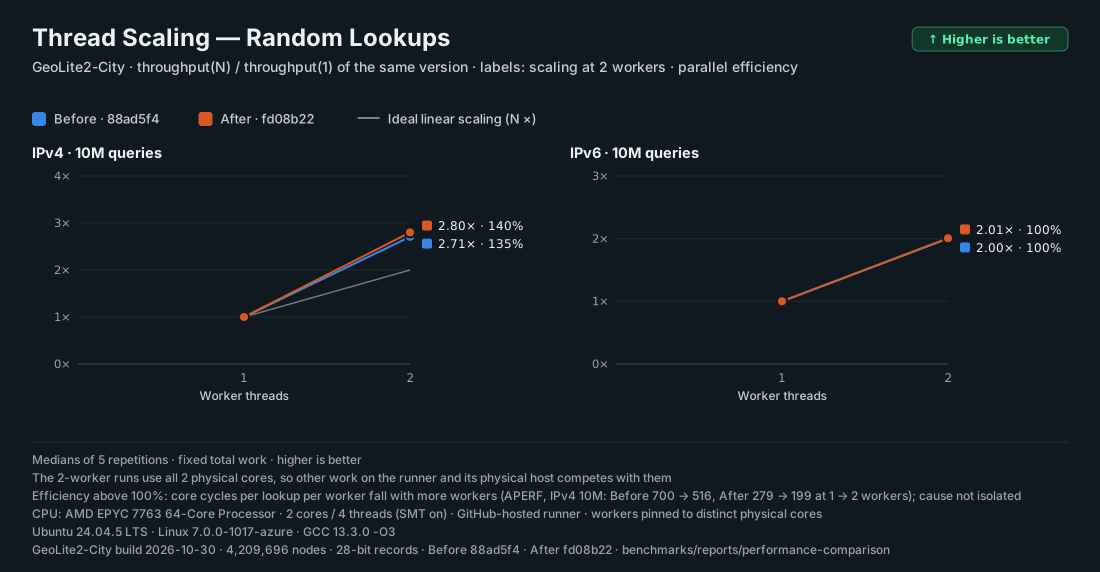
Thread scaling
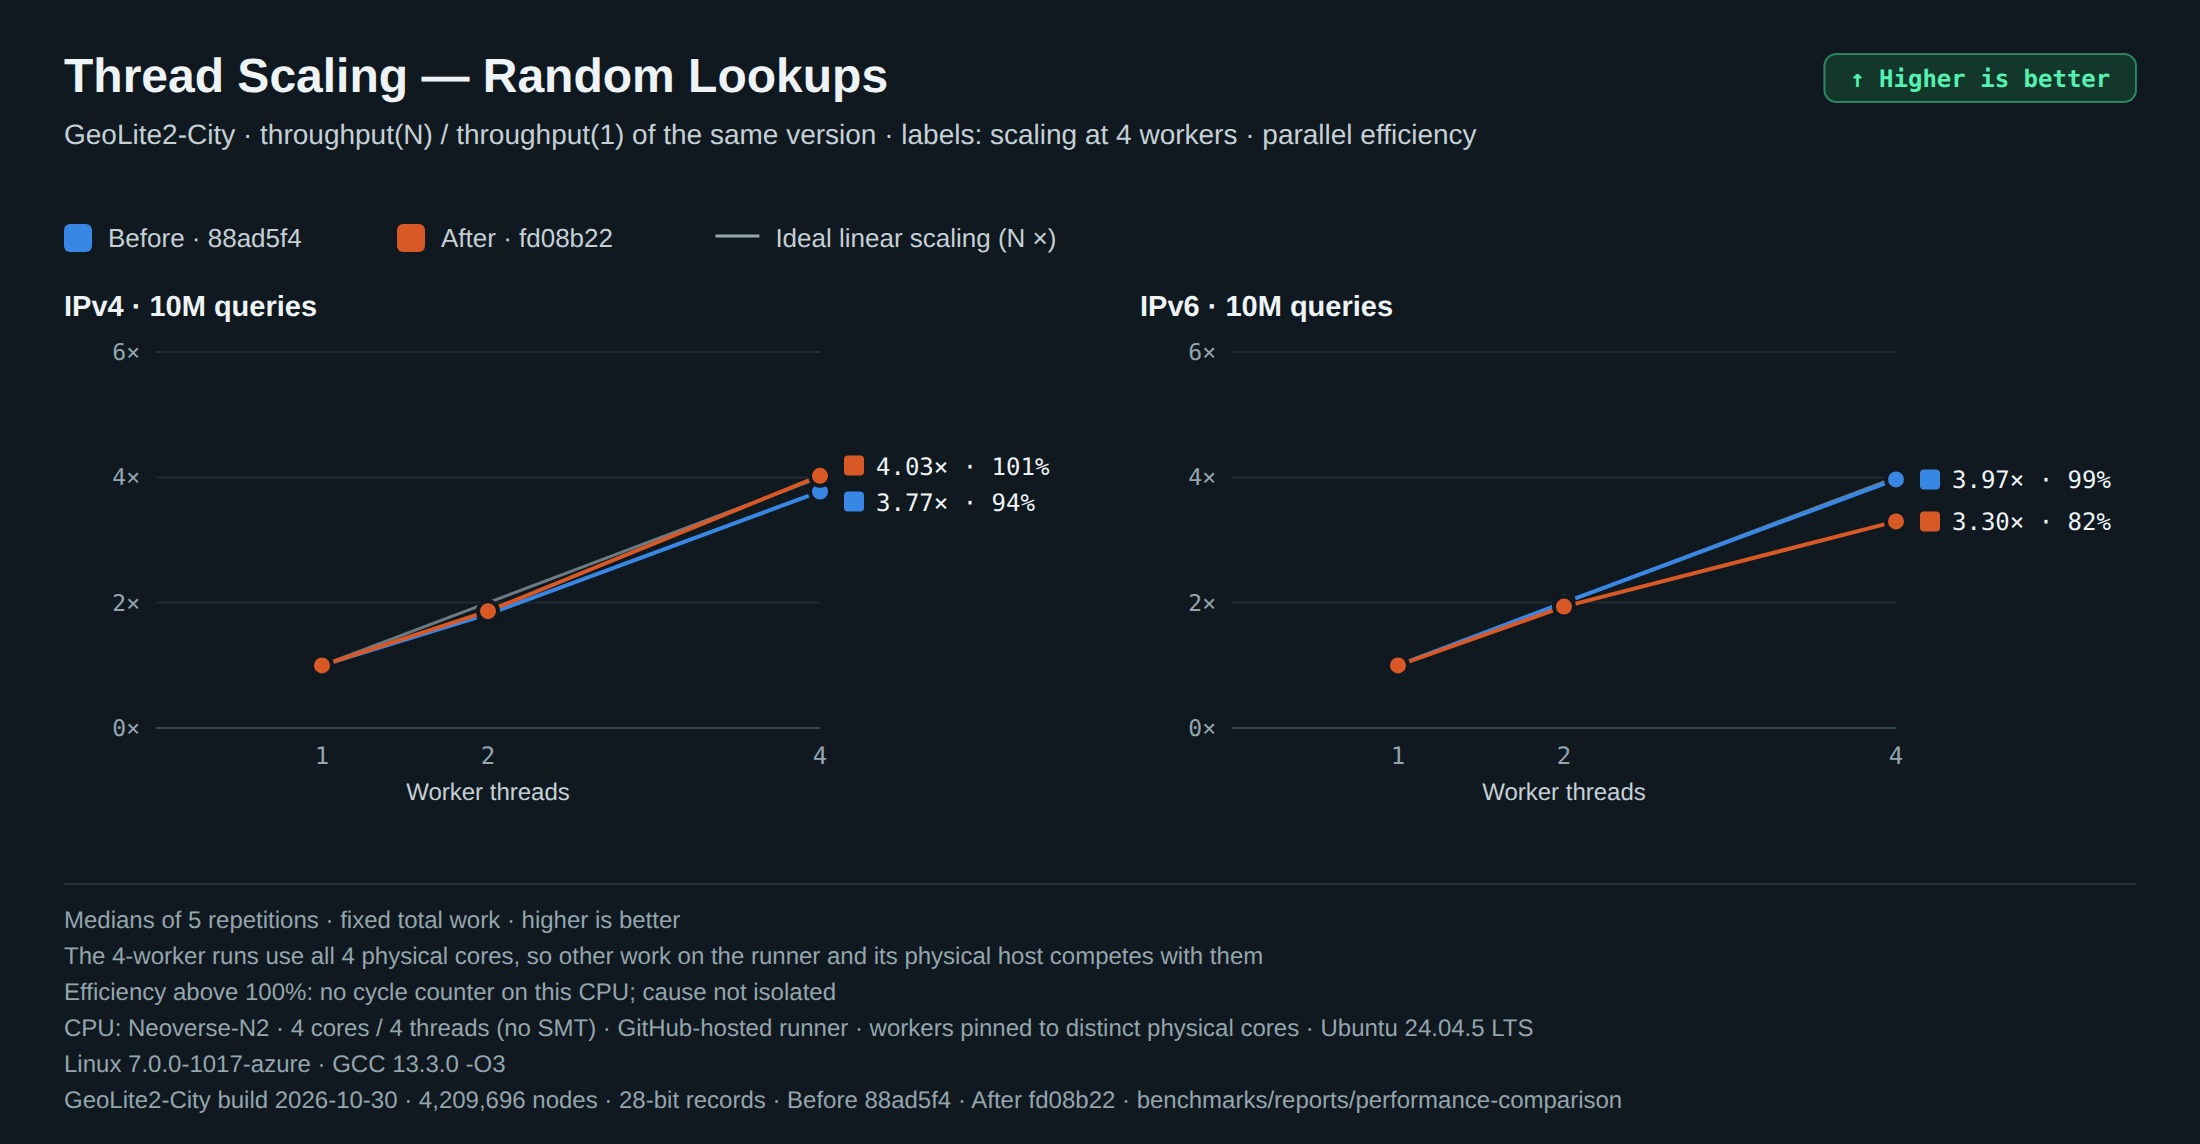
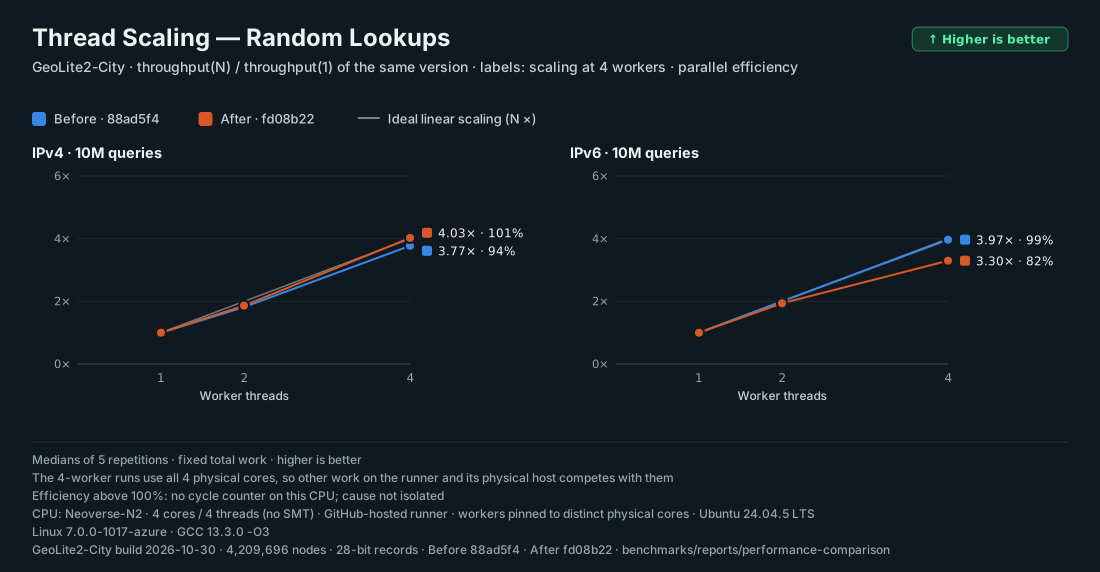
Scaling = throughput(N) / throughput(1) of the same version; parallel efficiency = scaling / N × 100. Configurations that scale above 100% do so because the measured core cycles per lookup of each worker drop as workers are added (see the chart footers); the cause was not isolated.
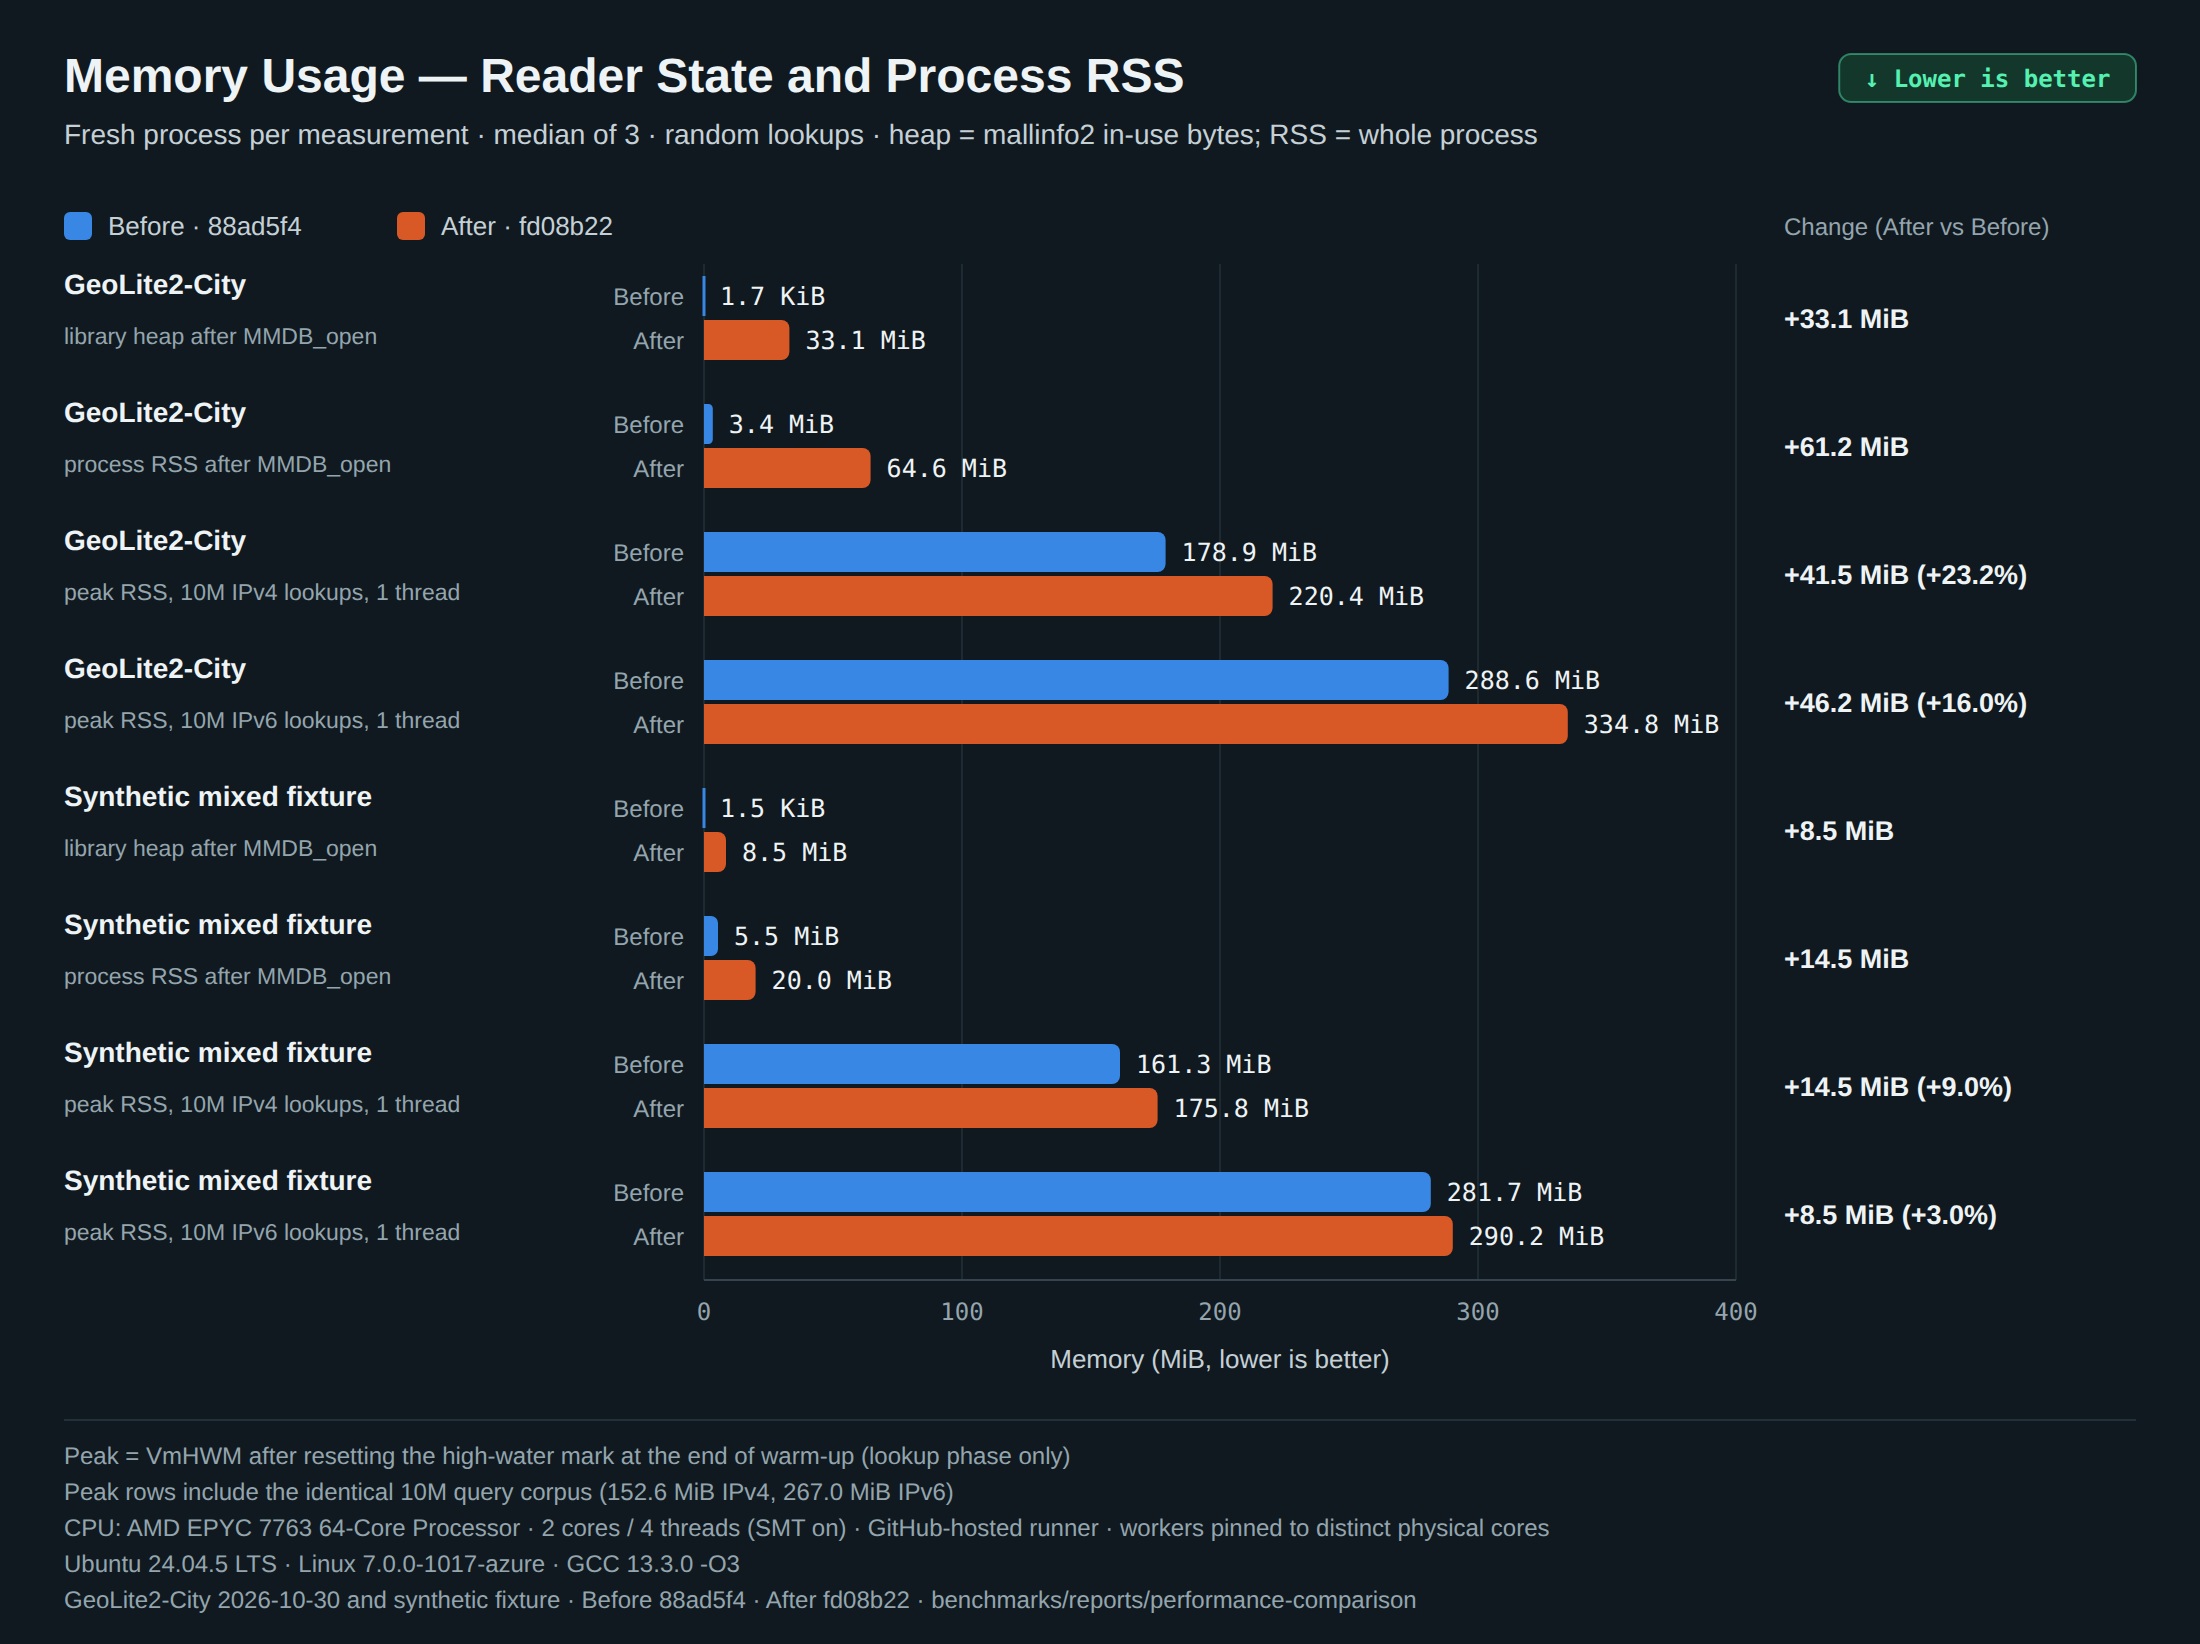
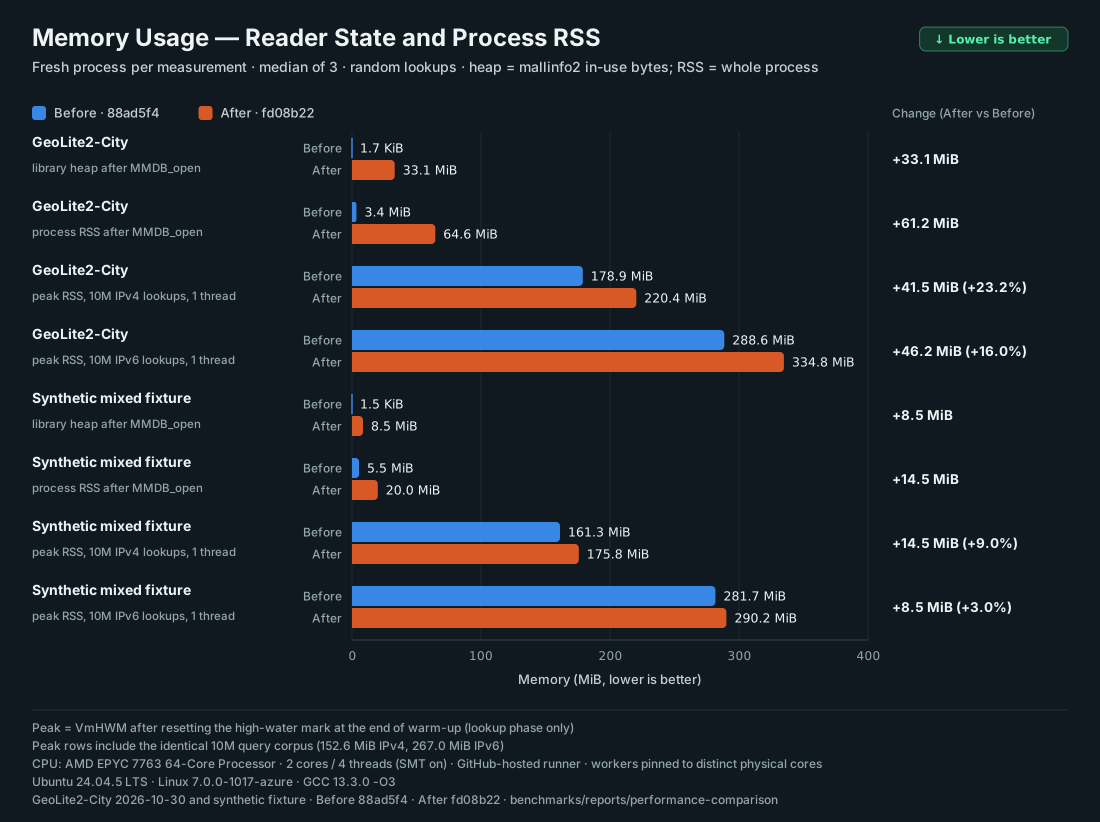
Measured in fresh processes with the same preparation and warm-up as the throughput campaign. Process RSS is a whole-process metric; the library heap (mallinfo2 in-use bytes after MMDB_open) isolates reader and index allocations.
Memory Usage — Reader State and Process RSS
Fresh process per measurement, median of 3 · heap from mallinfo2 · RSS is whole-process
GeoLite2-City: library heap after MMDB_open 1.7 KiB → 33.1 MiB; process RSS after open 3.4 MiB → 64.6 MiB. Peak RSS during 10M-query lookups is shown with the identical query corpus included.
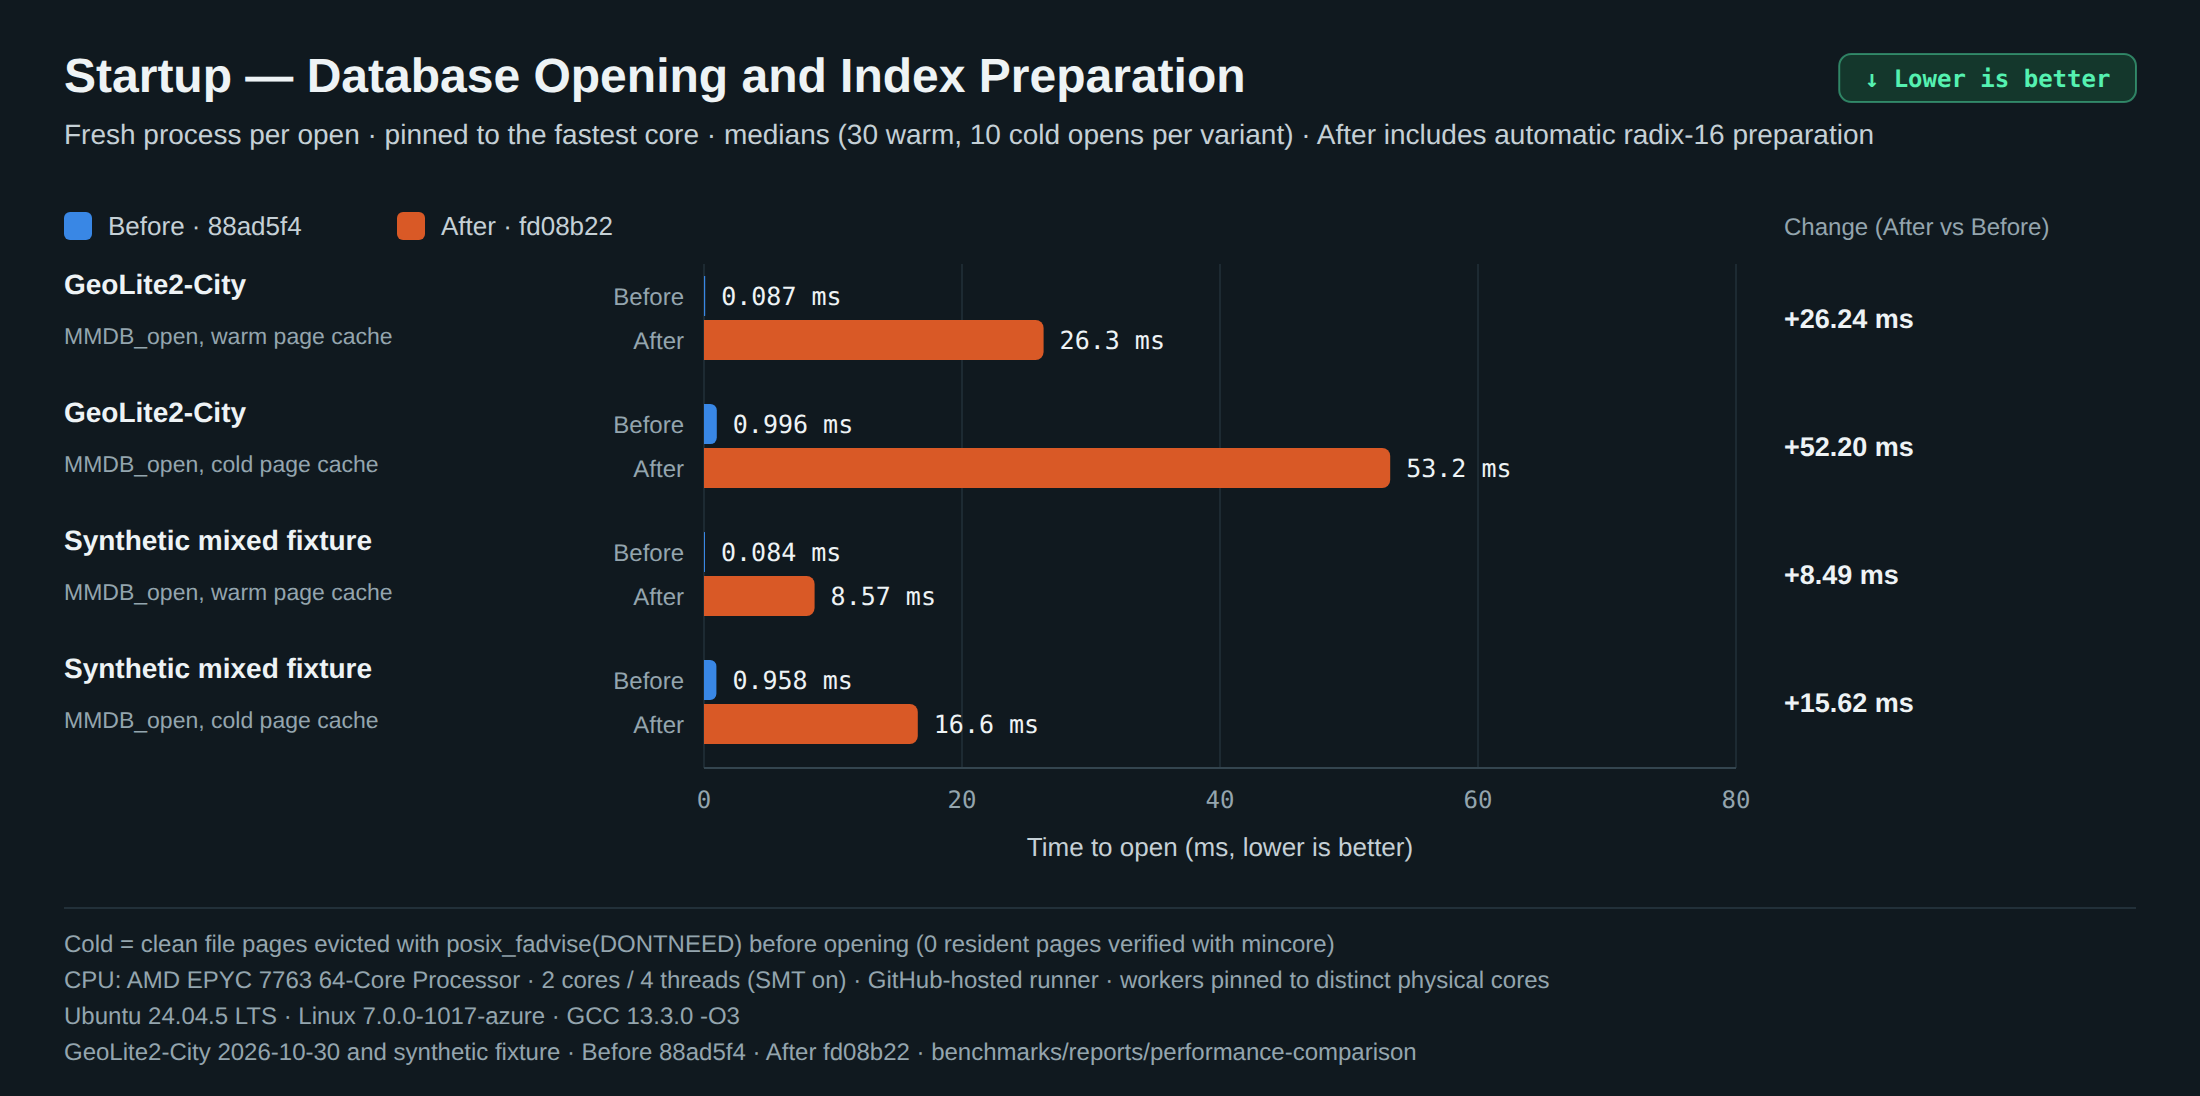
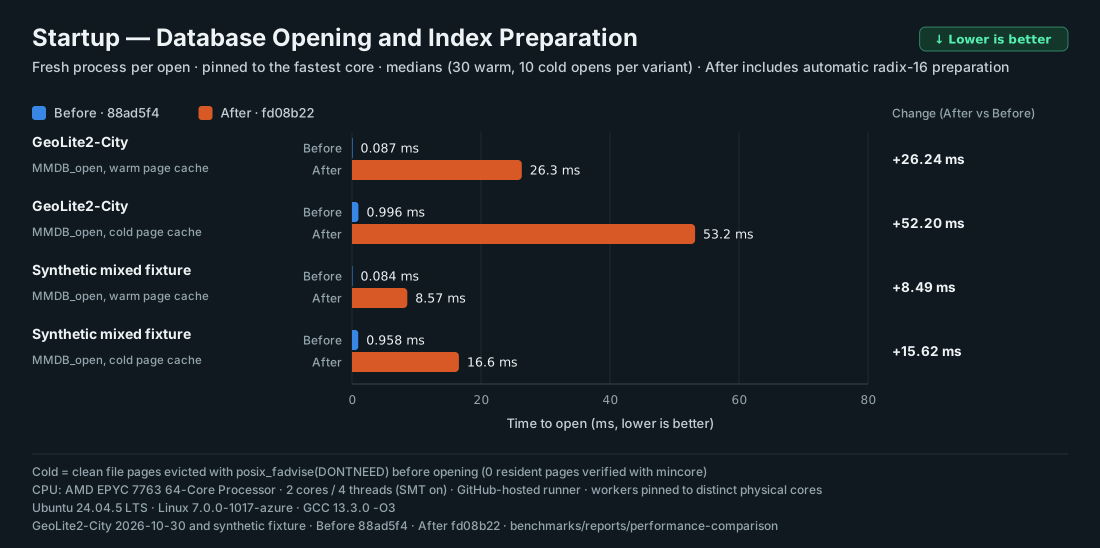
Startup and index preparation
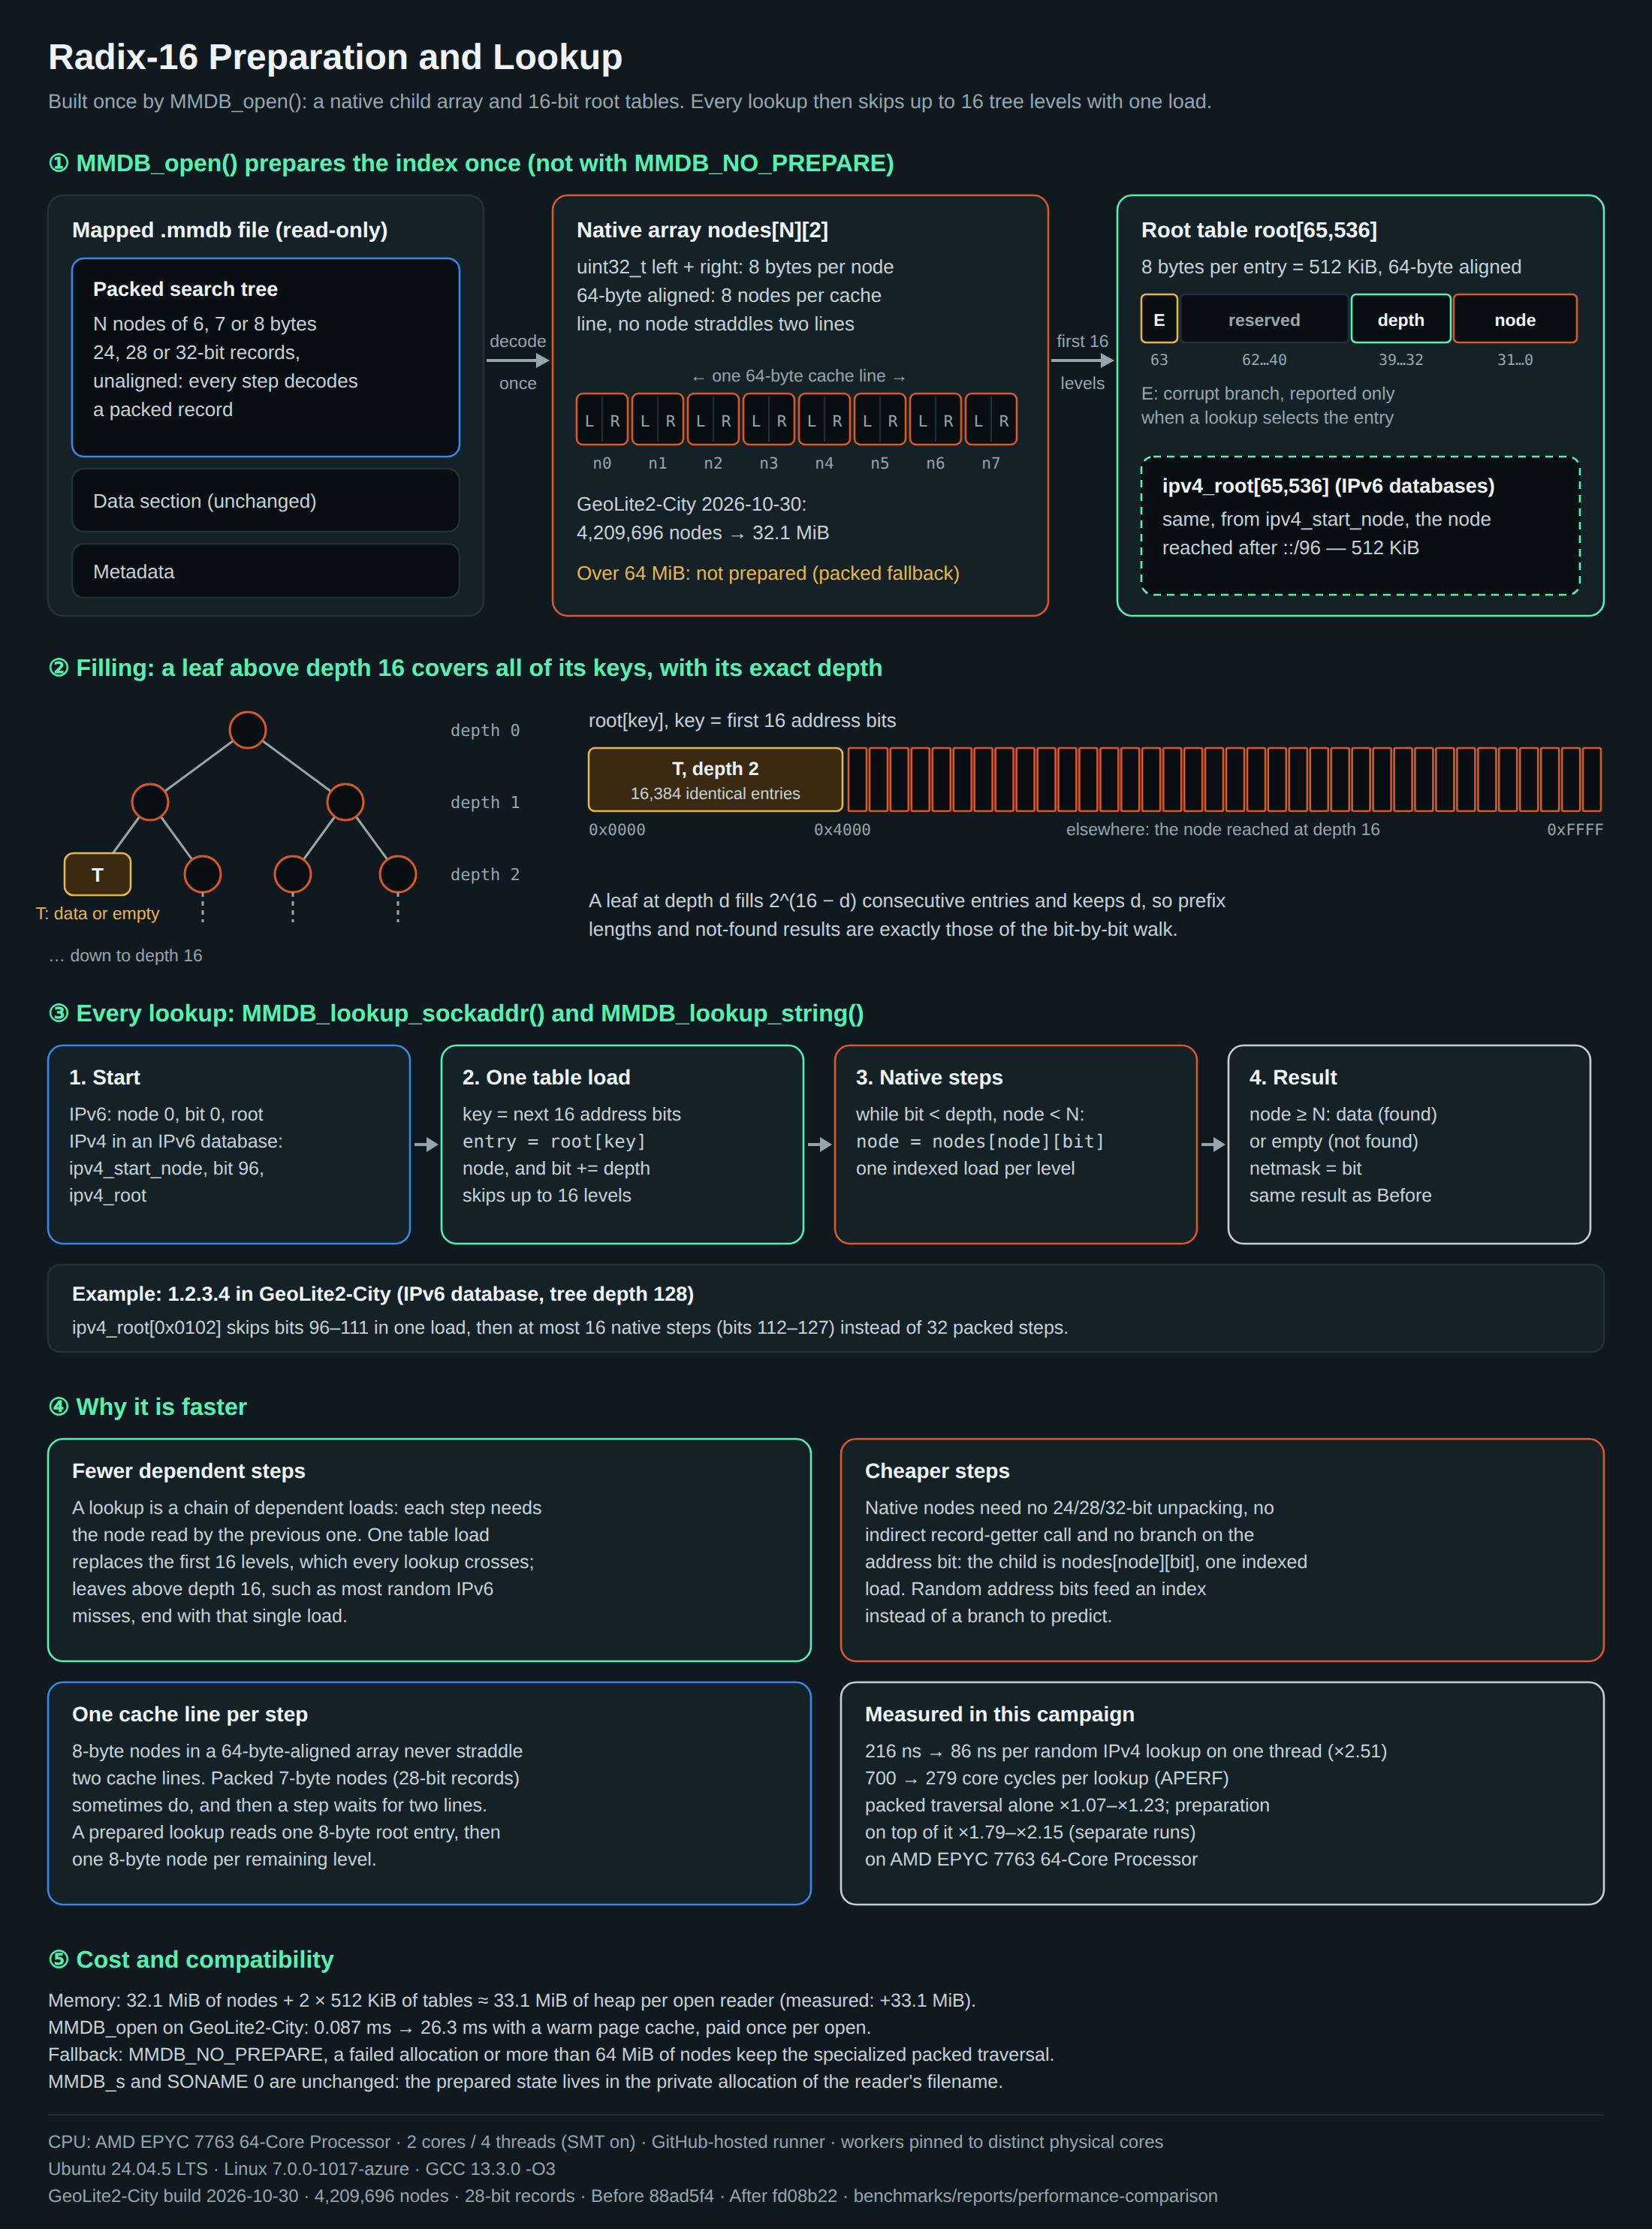
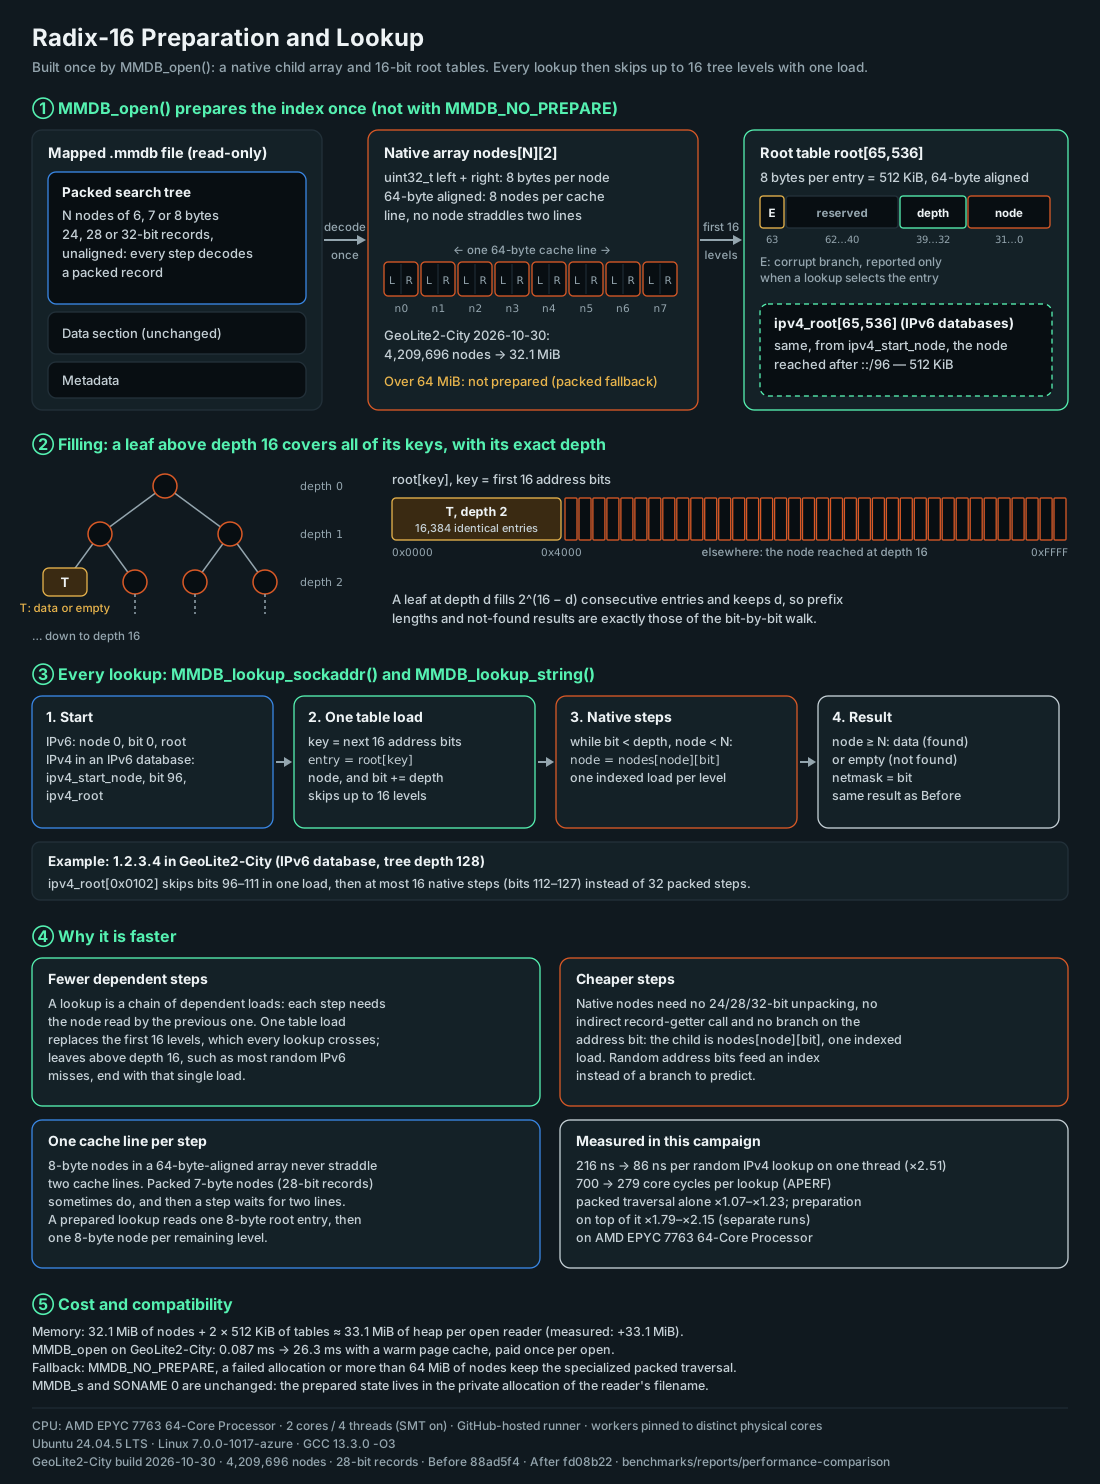
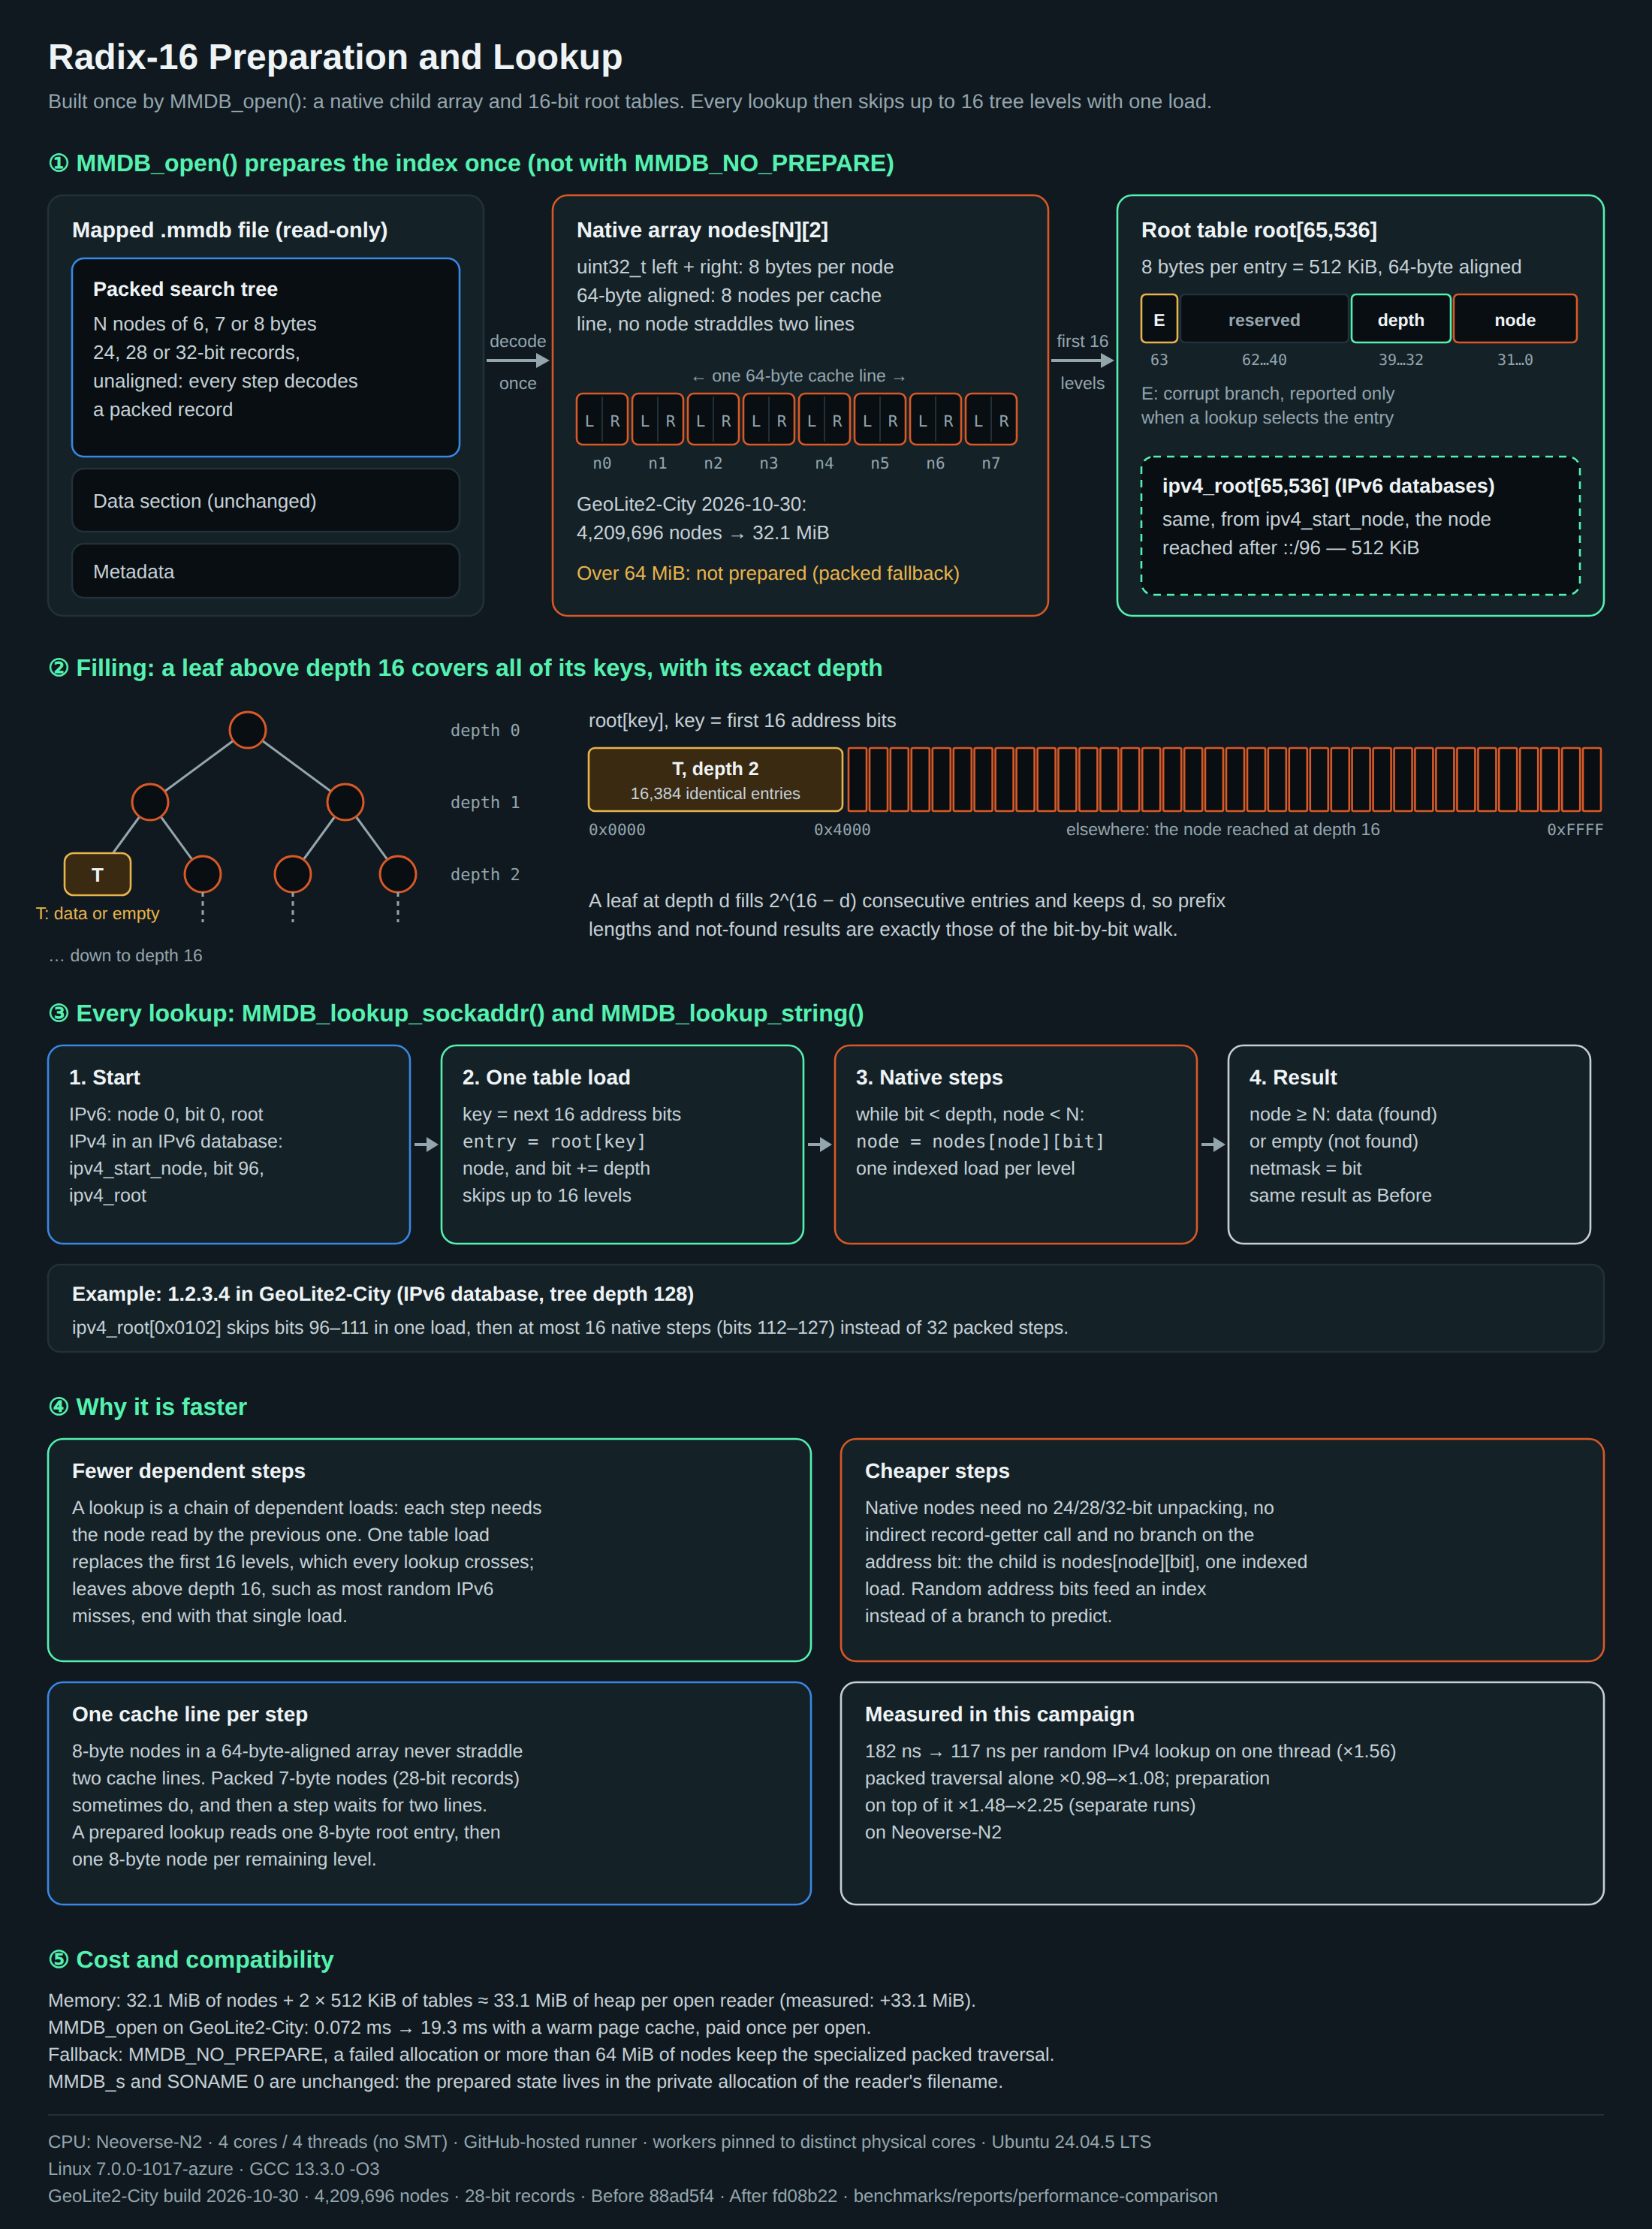
After builds its native child array and 65,536-entry root tables inside MMDB_open; MMDB_NO_PREPARE skips that work. Opening time is measured separately from steady-state lookups.
Startup — Database Opening and Index Preparation
Fresh process per open, pinned to one core · warm and cold page cache
MMDB_open on GeoLite2-City with a warm page cache: 0.087 ms → 26.3 ms (After prepares the native tree and radix-16 tables before returning).
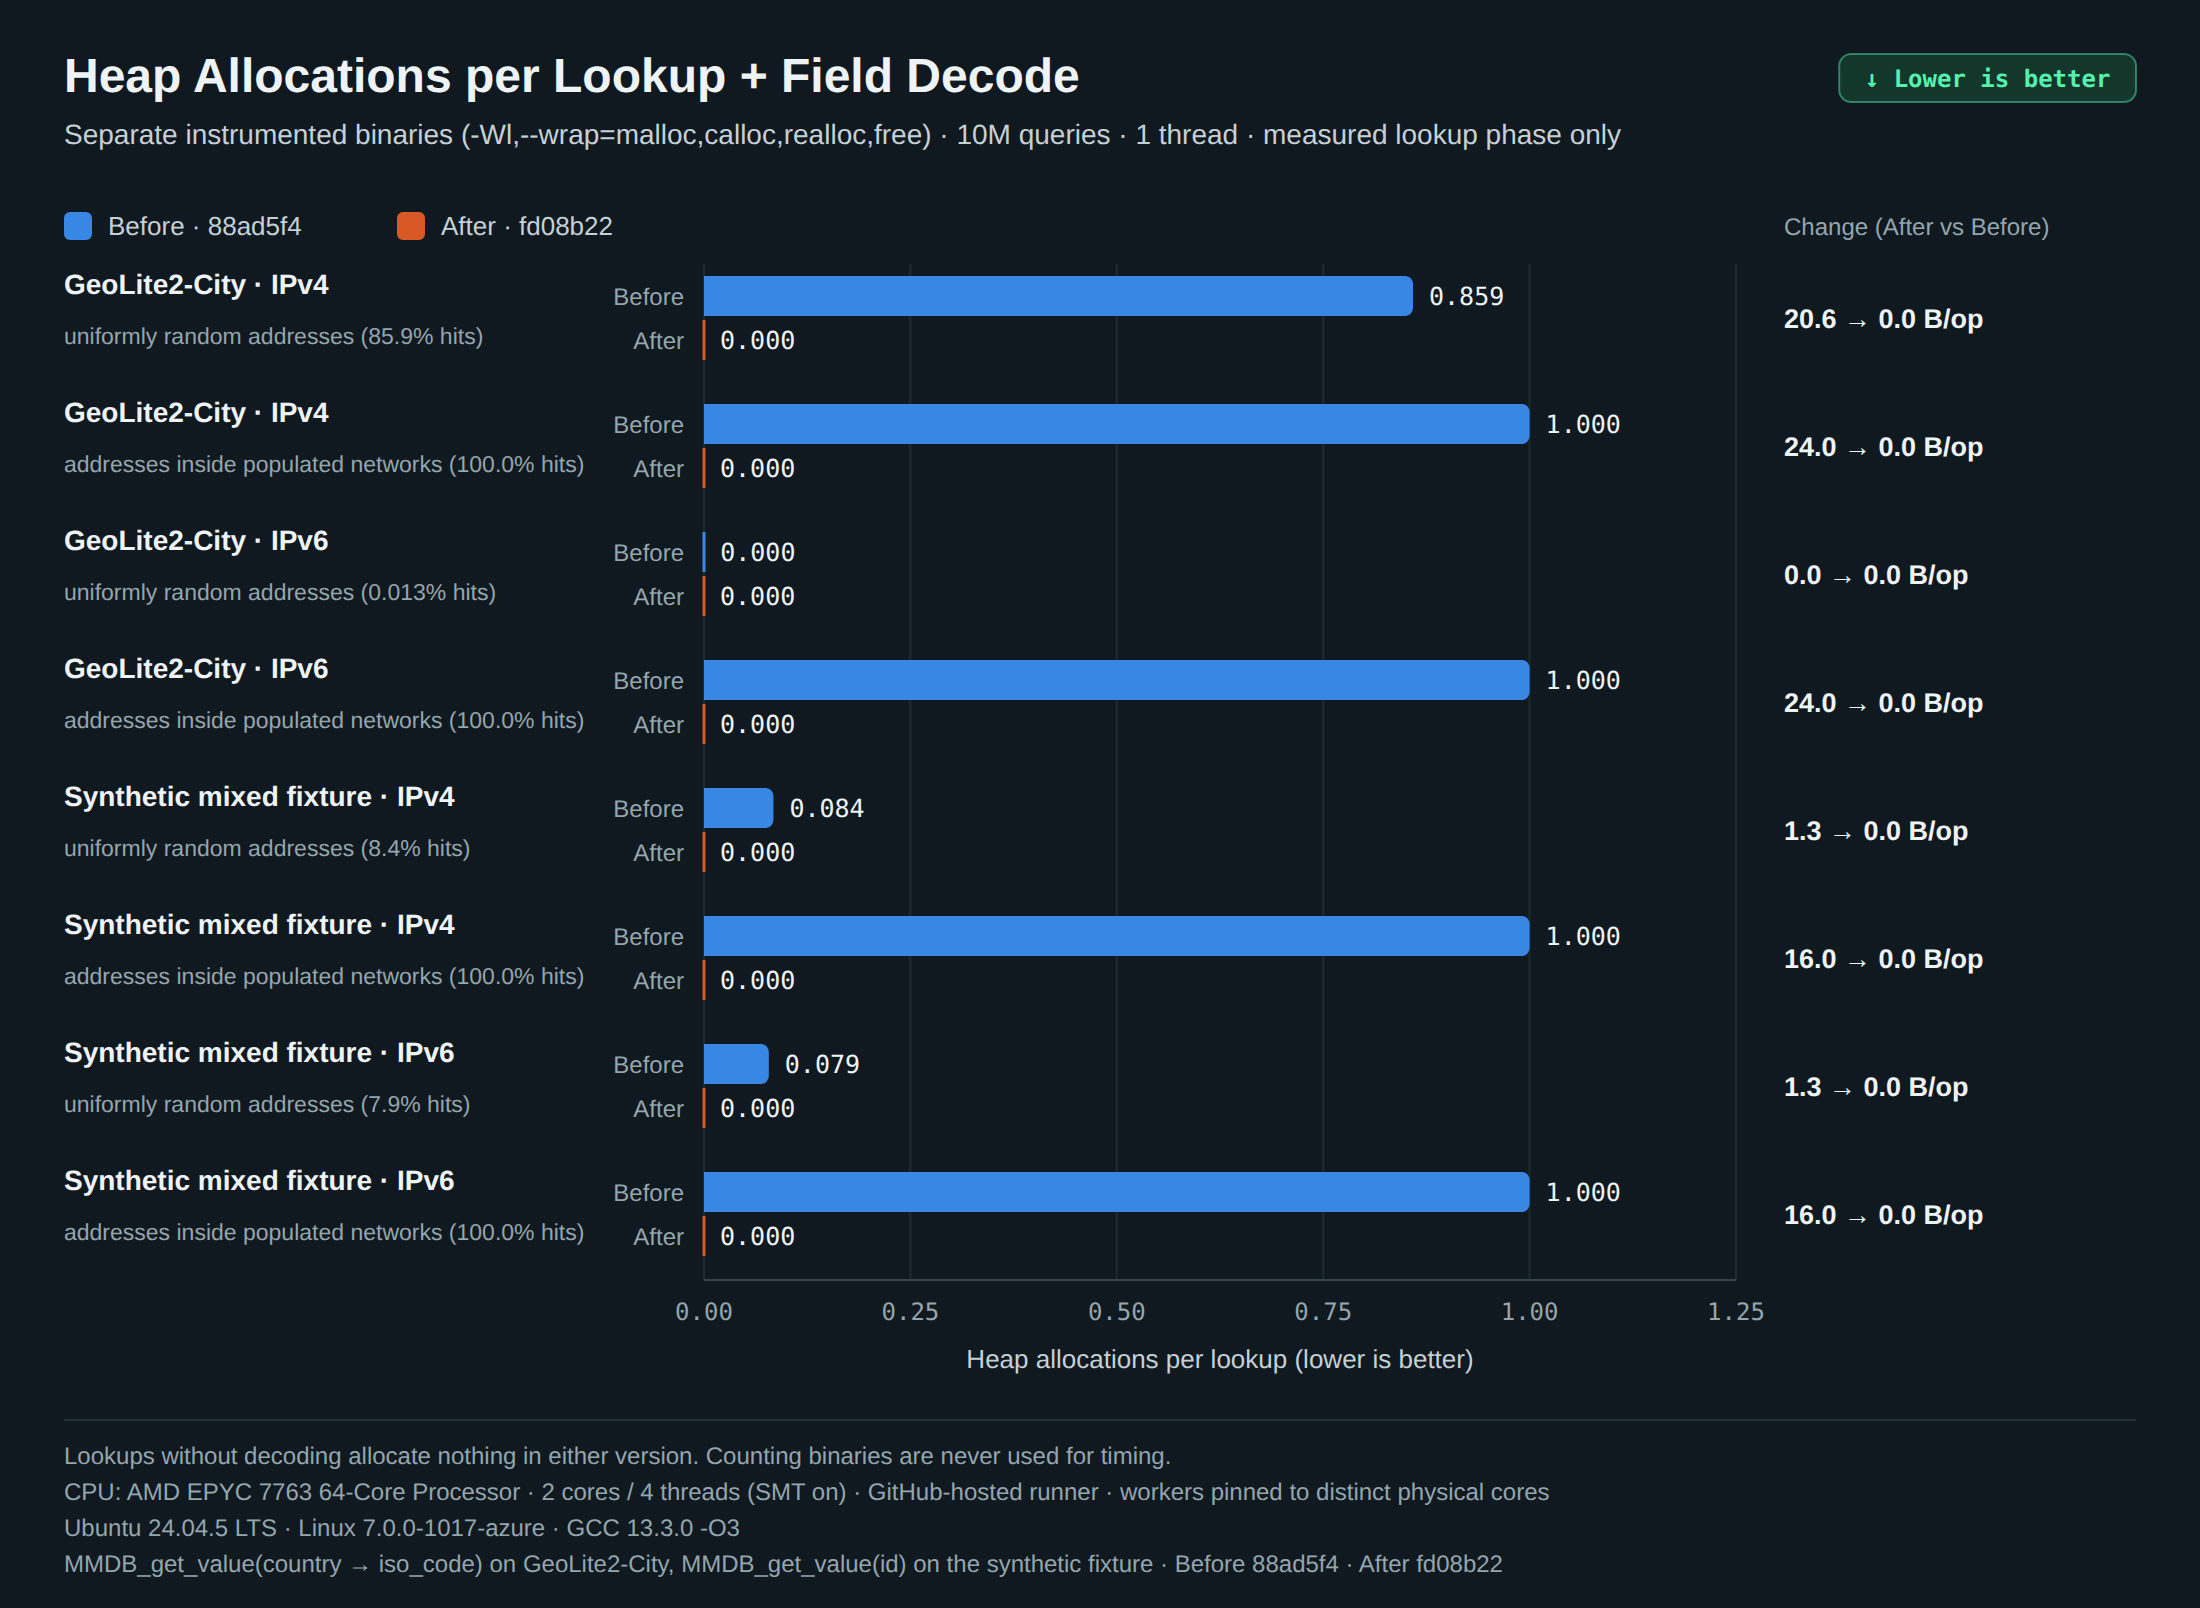
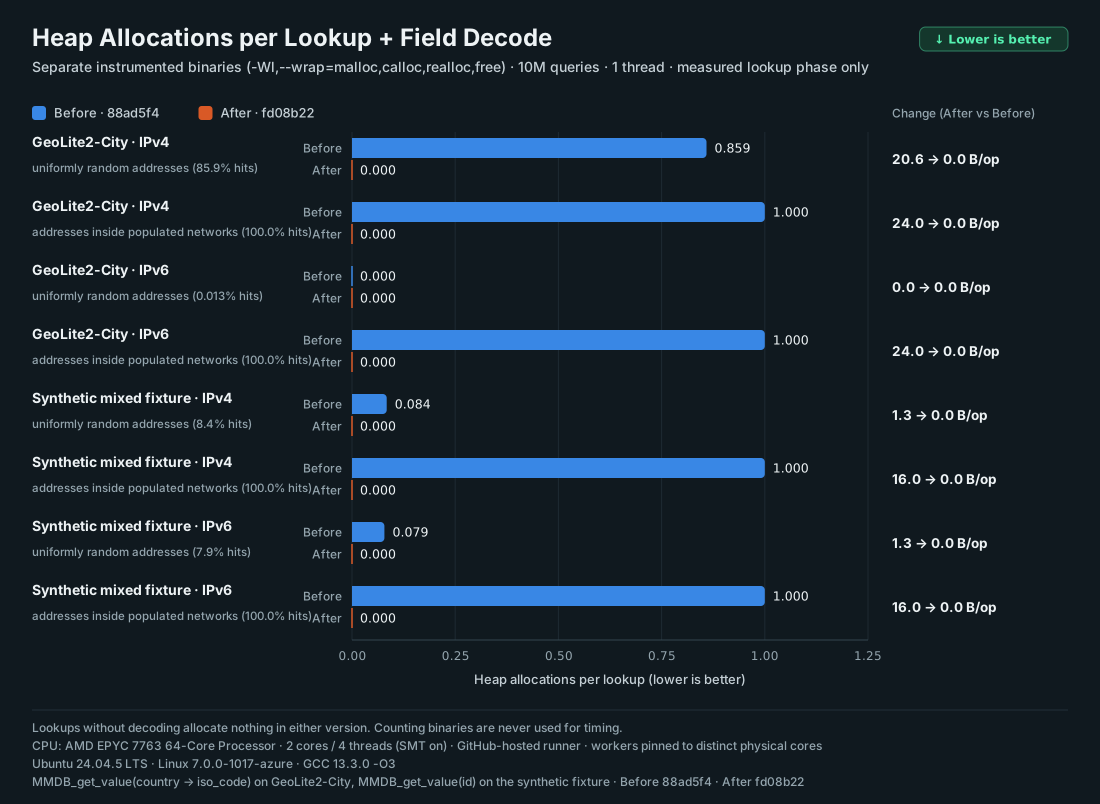
Allocations
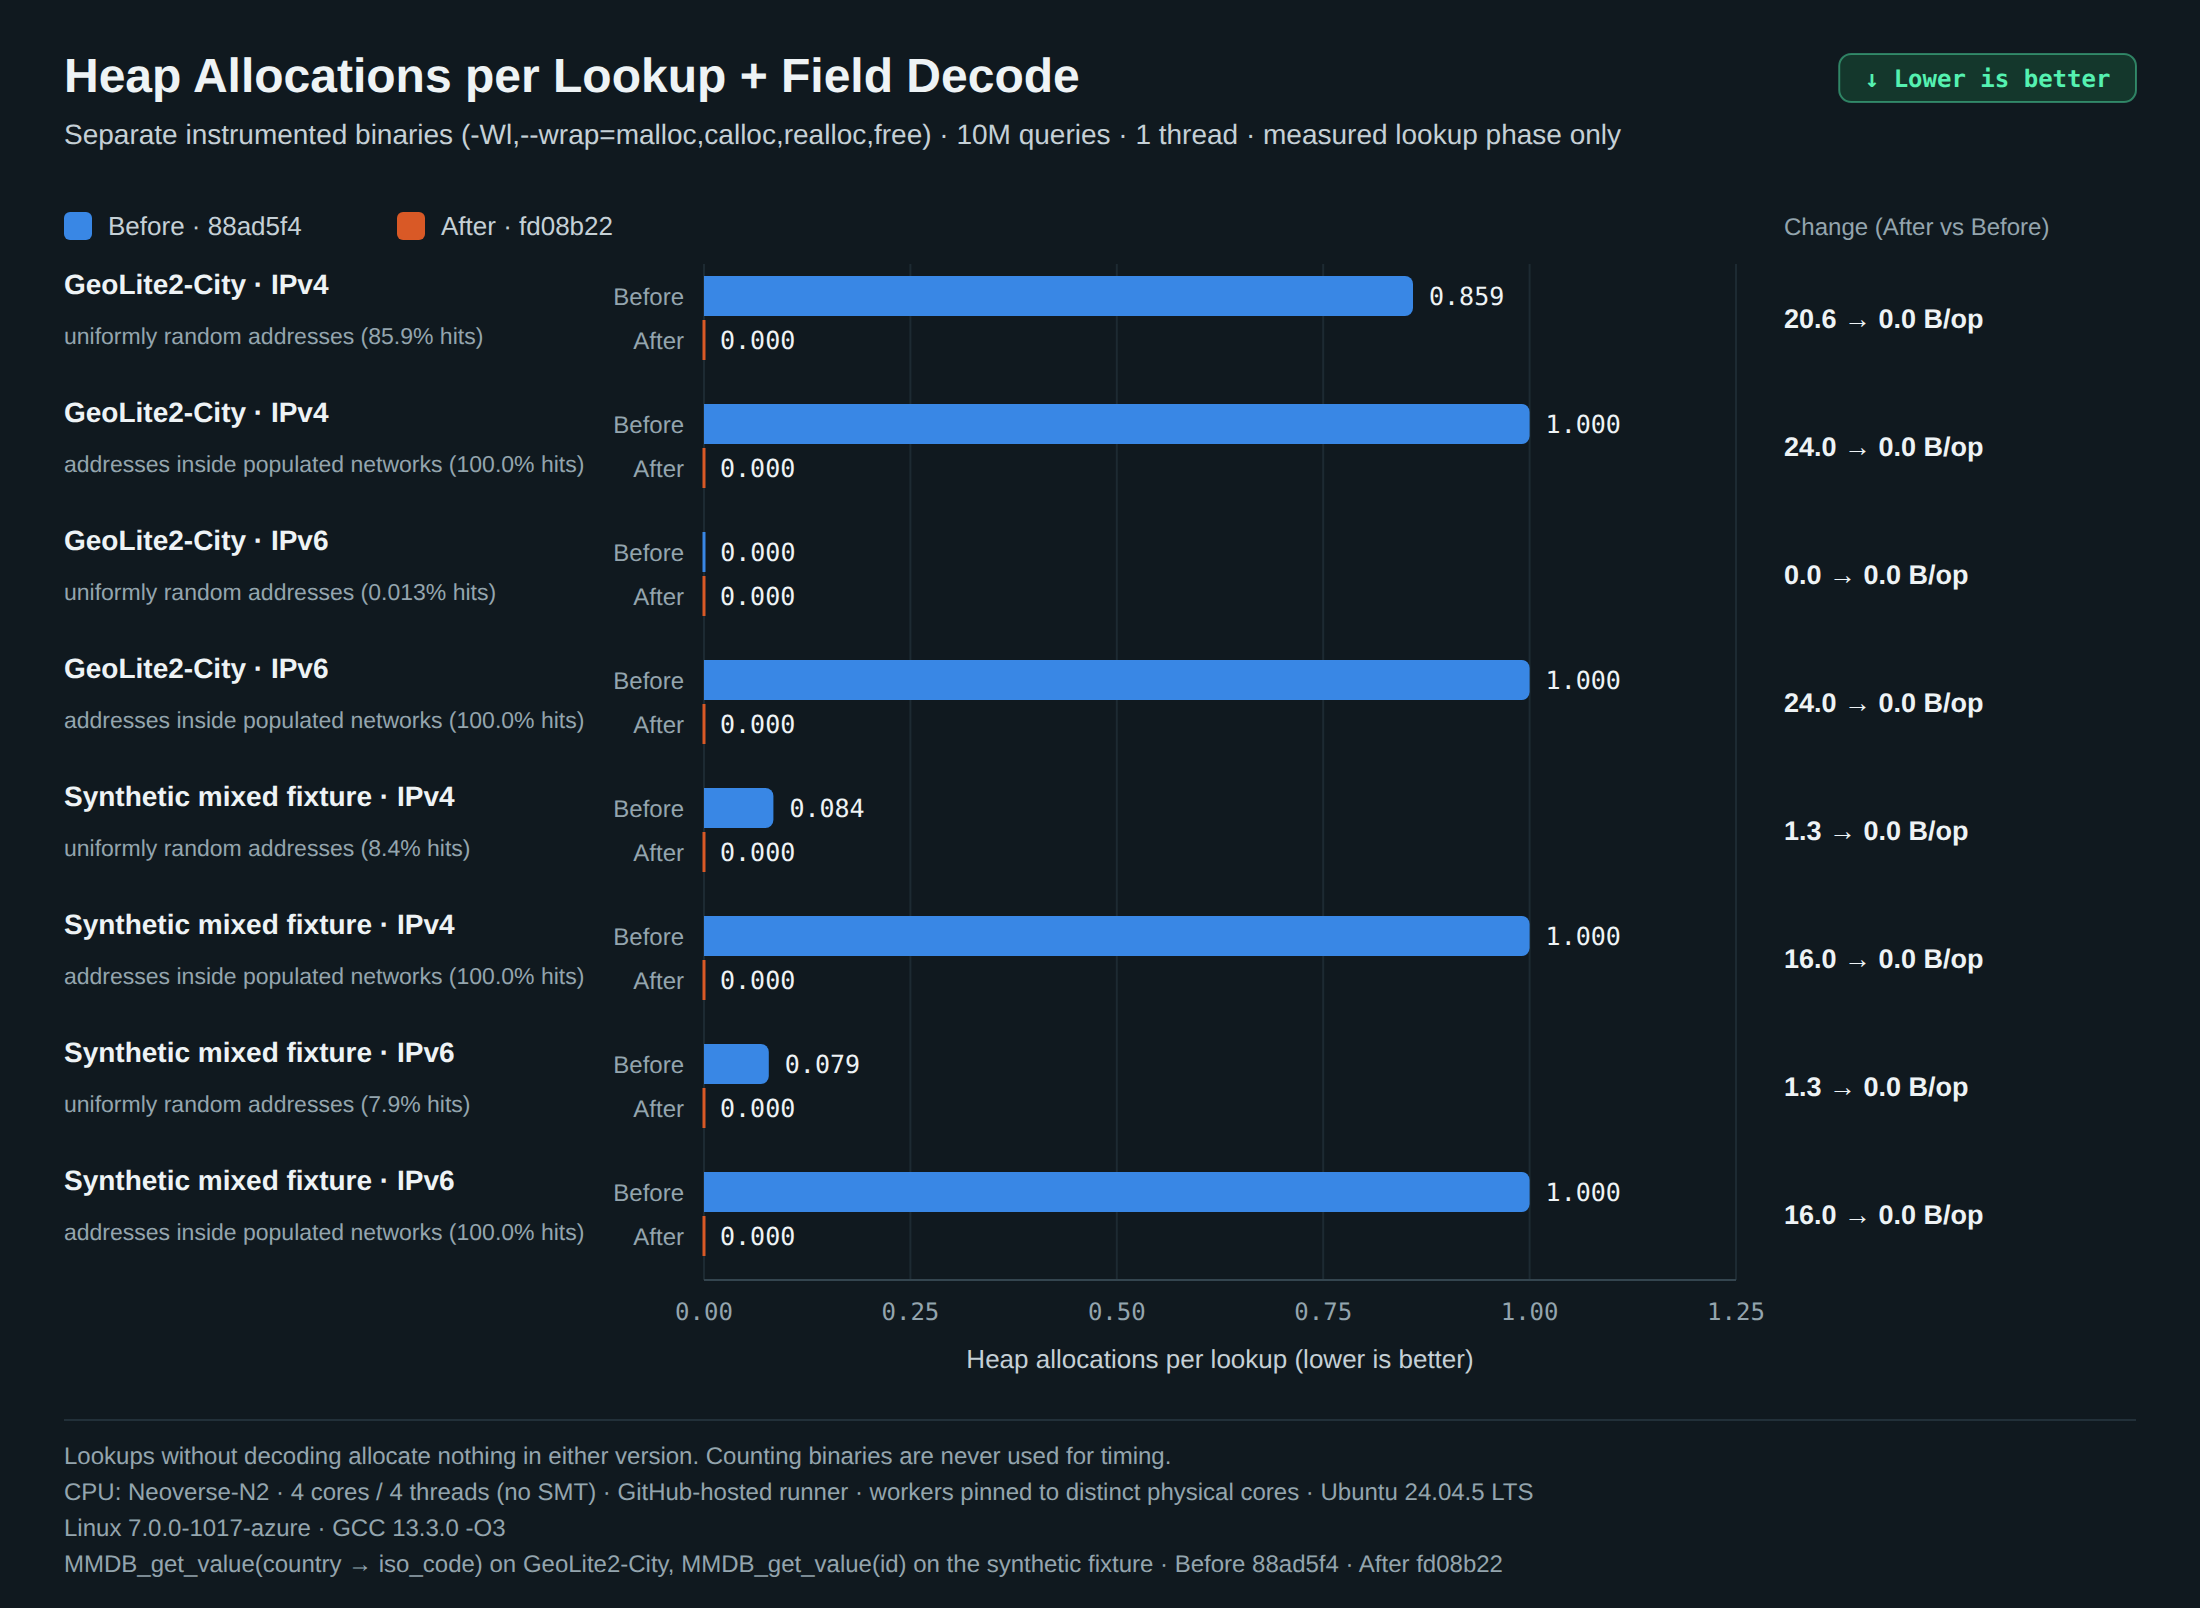
Heap Allocations per Lookup + Field Decode
Instrumented binaries only · measured lookup phase
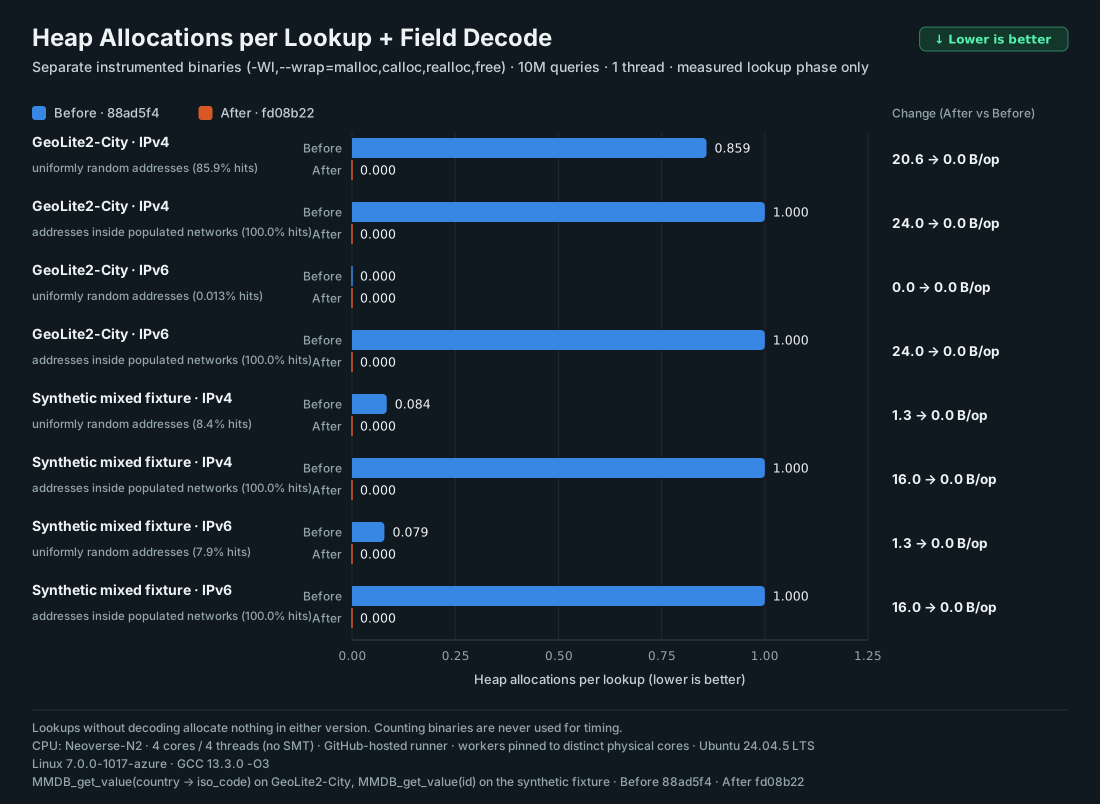
Before allocates one temporary lookup-path array per MMDB_get_value call on a hit; After uses a stack buffer for paths of up to seven components and allocates nothing.
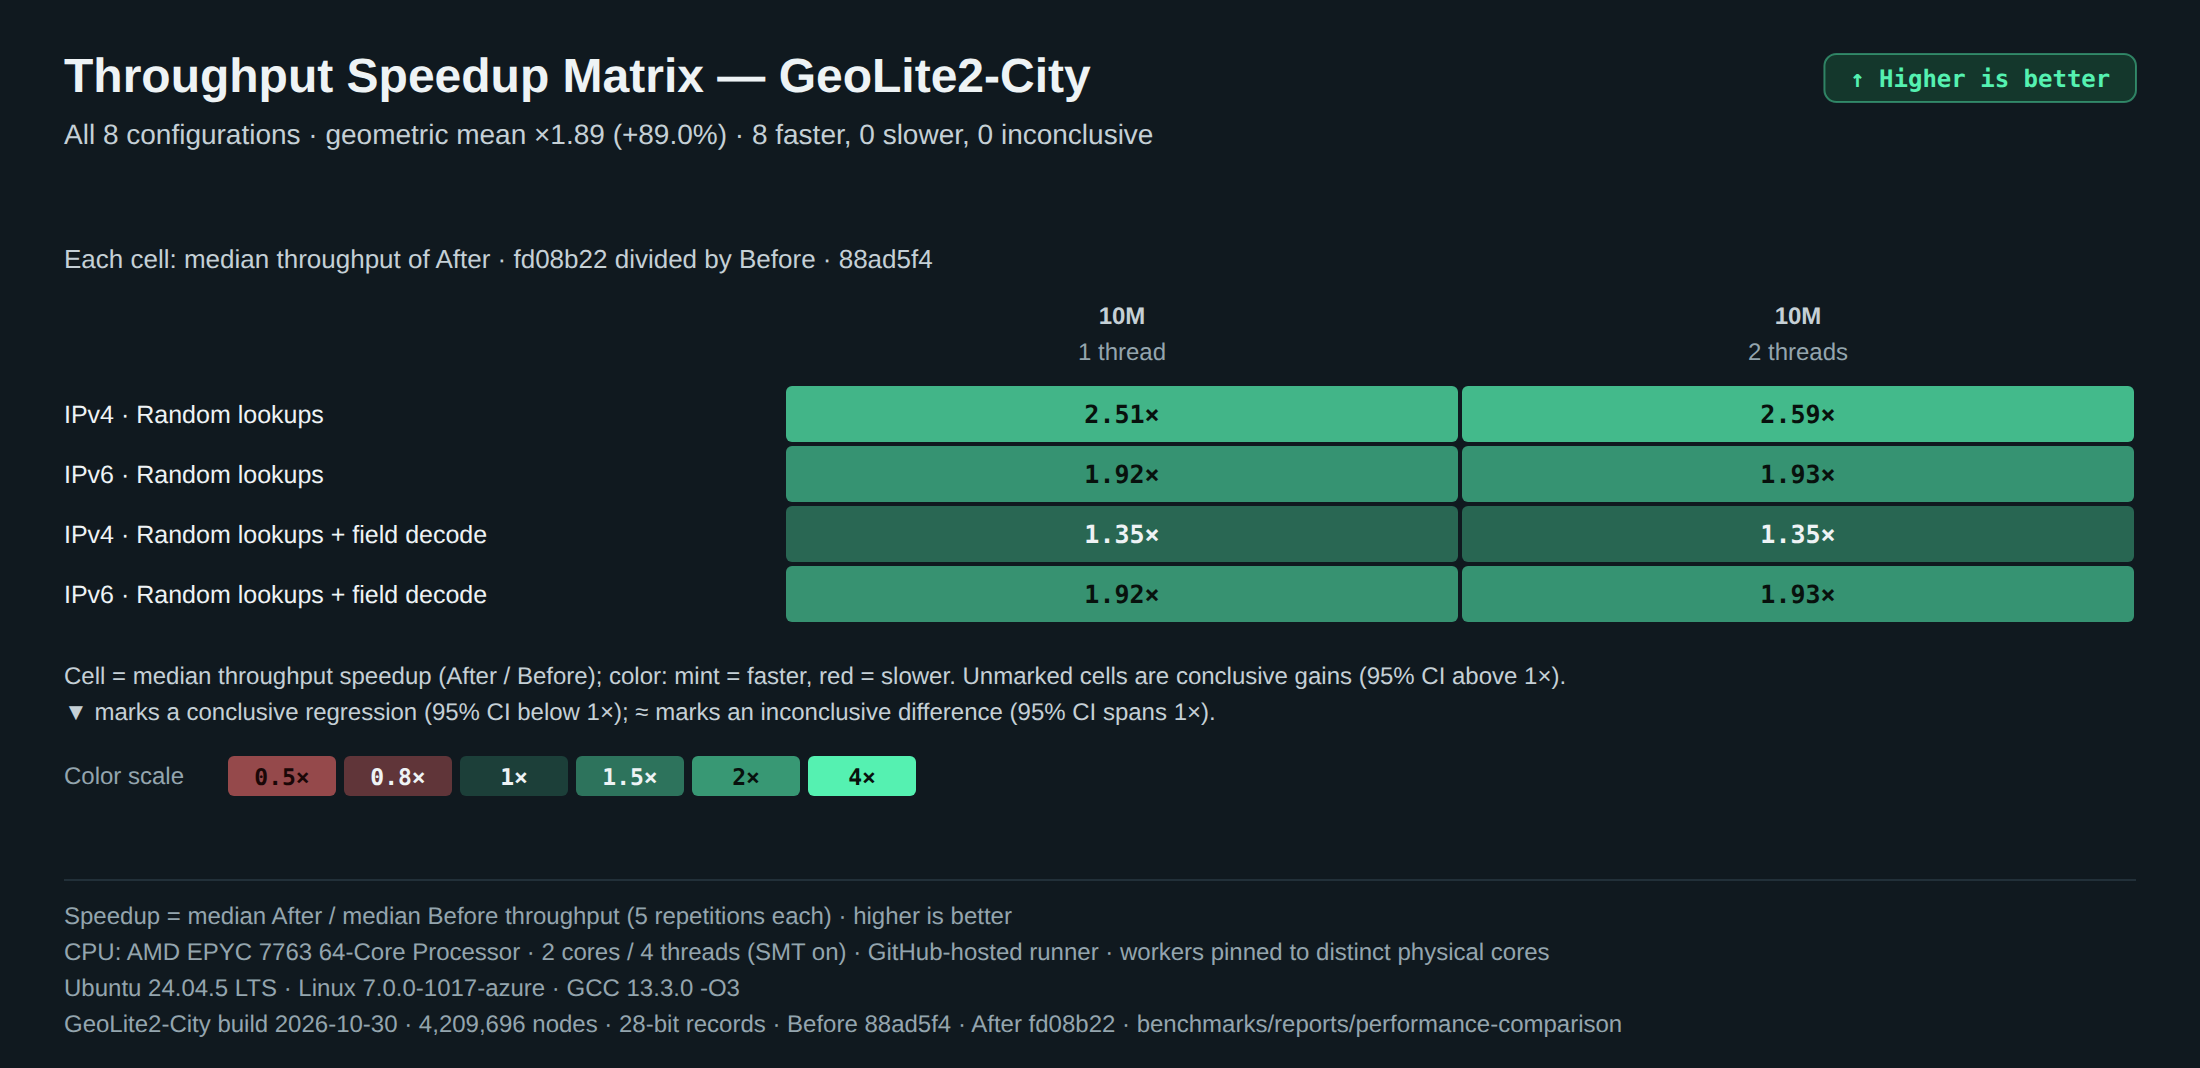
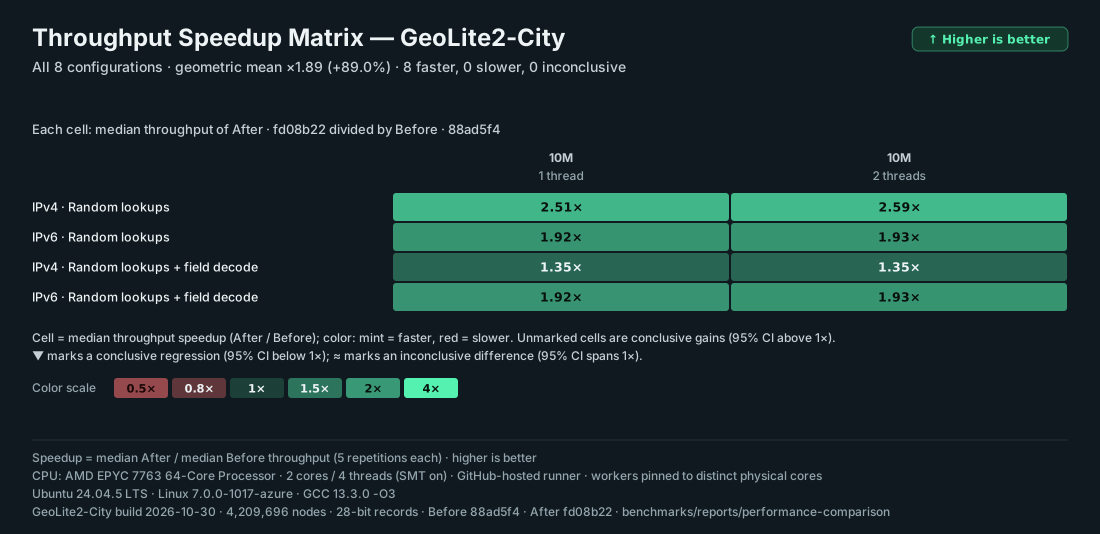
Every throughput configuration
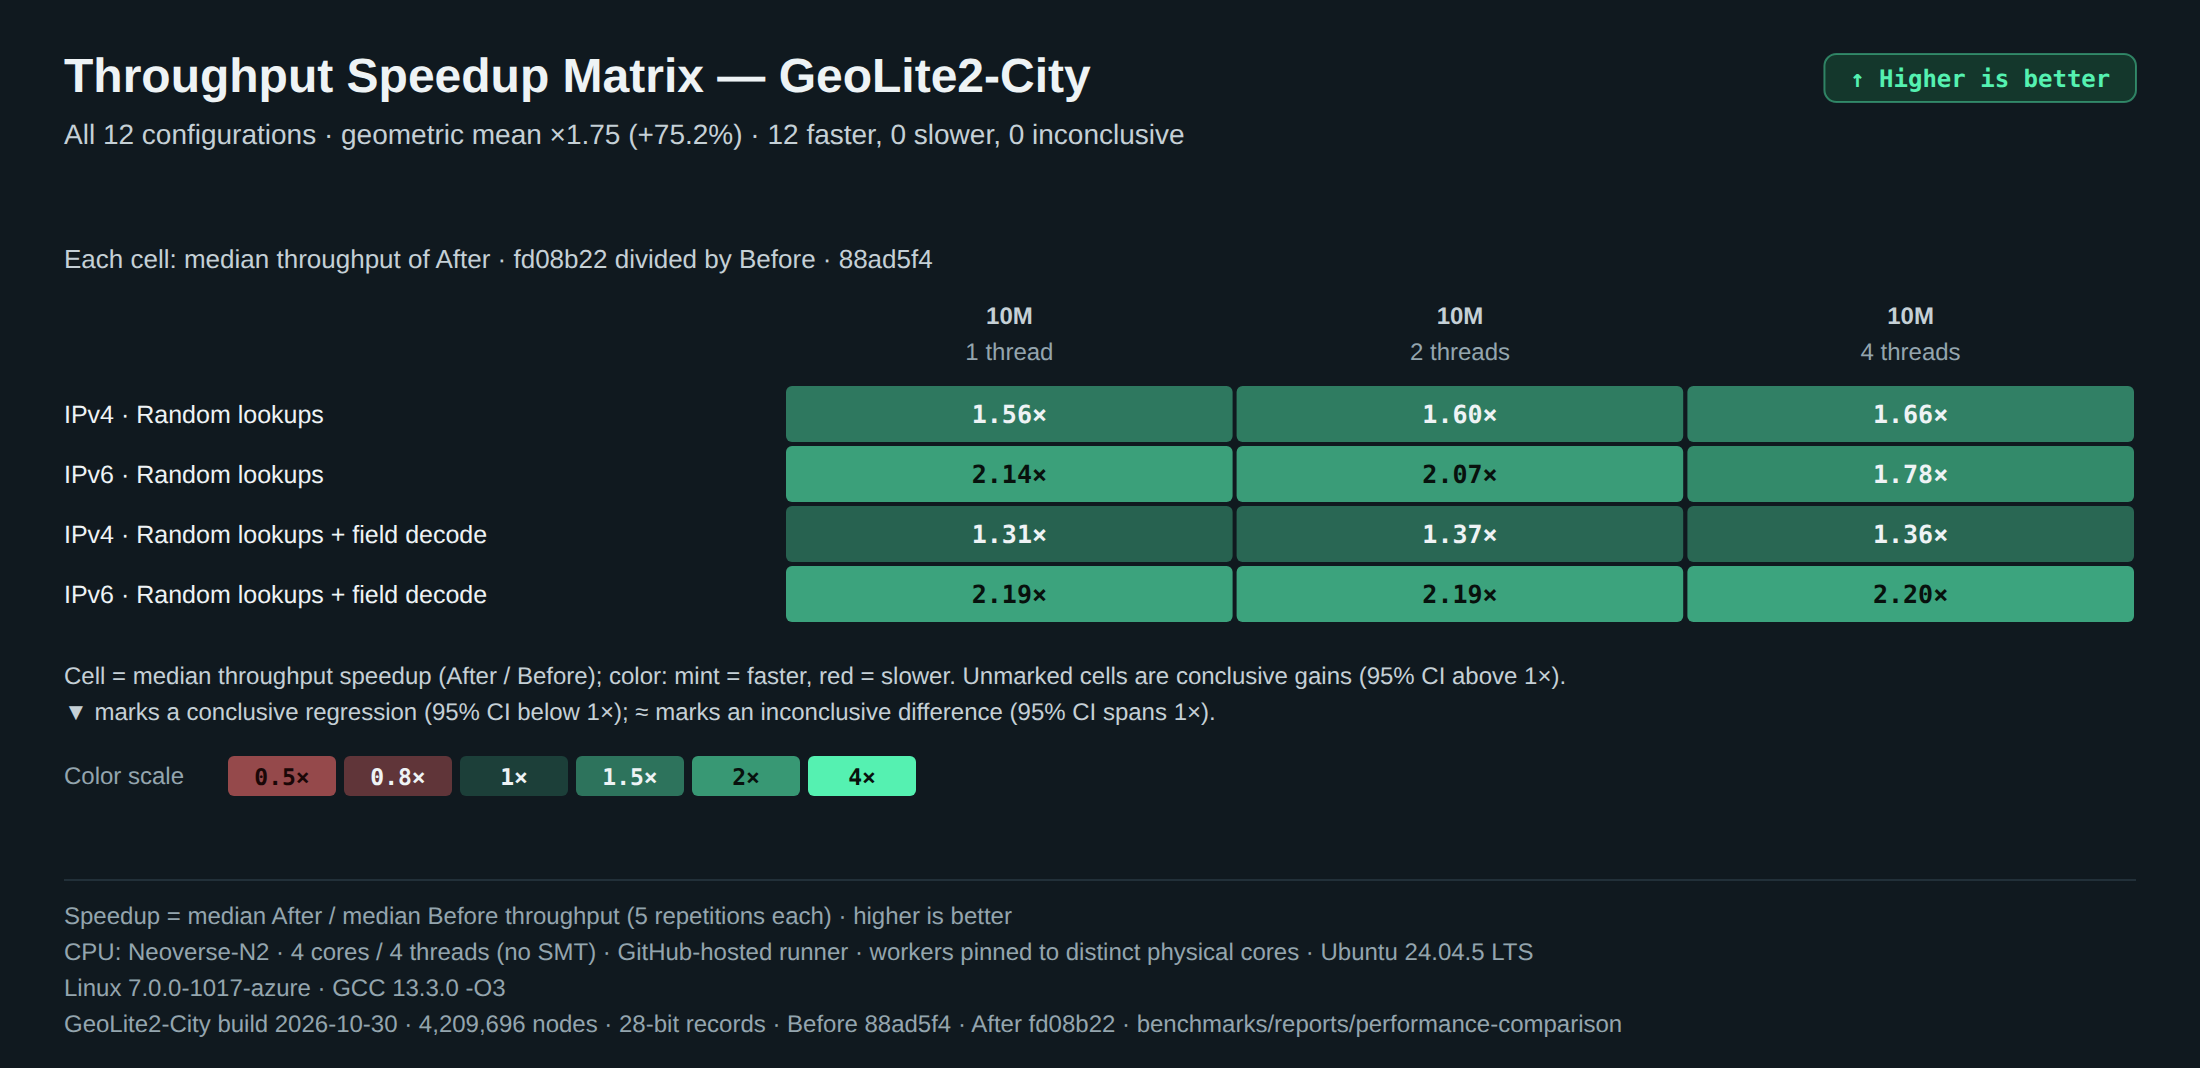
Throughput Speedup Matrix — GeoLite2-City
Rows: family × profile × operation · columns: worker threads
Attribution between the traversal changes
A separate three-way campaign isolates the specialized packed traversal (After opened with MMDB_NO_PREPARE) from the automatic radix-16/native preparation, on identical corpora with 5 repetitions per variant in rotating order. Ratios are medians with 95% bootstrap intervals.
GeoLite2-City
IPv4
Random
10M
1
5.99
6.77
14.49
×1.13 [1.04–1.40]
×2.14 [1.52–2.37]
×2.42 [1.72–3.00]
GeoLite2-City
IPv4
Random
10M
2
12.64
15.53
33.39
×1.23 [1.18–1.26]
×2.15 [2.10–2.24]
×2.64 [2.58–2.75]
GeoLite2-City
IPv6
Random
10M
1
30.71
33.10
59.33
×1.08 [1.07–1.09]
×1.79 [1.76–1.80]
×1.93 [1.90–1.95]
GeoLite2-City
IPv6
Random
10M
2
62.00
66.05
118.6
×1.07 [1.06–1.08]
×1.80 [1.74–1.81]
×1.91 [1.86–1.95]
Result tables
Rows follow the filters above unless “show every configuration” is checked. Click a column header to sort.
GitHub-hosted runner; system CPU busy median 44.2% (p90 50.5%), load average median 1.63
Versions
Before 88ad5f46d9c884fc4a8533374b457cb9e3ee121f and After fd08b229052ae34e9f2c3c3df4f64ed9d43f4347, exported with git archive into isolated source trees (pinned submodules copied and verified). Static libraries built with CMake Release (-O3 -DNDEBUG) by the same GCC; the same bench.c links each archive. ldd shows no libmaxminddb shared object; symbol checks confirm which revision each binary contains.
Operations
lookup = MMDB_lookup_sockaddr on pre-built sockaddr structures (no text parsing in the timed loop). decode = lookup plus MMDB_get_value on hits (country → iso_code on GeoLite2-City, id on the synthetic fixture). Records without the field count as absent, identically in both versions.
Workloads
random: SplitMix64 (seed 0x6a09e667f3bcc909) over the whole IPv4 or IPv6 space. populated networks: every reachable data leaf is enumerated with MMDB_read_node, uniformly reservoir-sampled (2^20 networks), host bits randomized; IPv6 enumeration skips the IPv4 subtree and its aliases. Identical corpora (SHA-256 recorded) for both versions.
Throughput protocol
5 measured repetitions per configuration; one prepared process per version, triggered one repetition at a time, order alternating (even pairs Before first). Each repetition warms up with 1,000,000 queries in total, then workers pass a spin start gate. Throughput = completed lookups / wall-clock time from gate release to the last worker finishing. Thread-local checksums, no shared counters, no per-query timers.
Latency protocol
Separate campaign. Every 16th operation is timed with two CLOCK_MONOTONIC_RAW reads (back-to-back pair: min 20 ns, median 30 ns, p99 31 ns; included, not subtracted). Exact integer-nanosecond histograms from all workers and repetitions are merged before nearest-rank percentiles floor((n − 1) · p).
Statistics
Medians with 95% percentile bootstrap intervals (10,000 resamples, seed 0xc0ffee3). A difference is conclusive only when the interval of the ratio of medians excludes 1. Geometric means weight every configuration equally.
Memory and startup
Fresh processes: 3 per memory configuration (several at once, each pinned to its own core; nothing is timed) and 30 warm and 10 cold opens per startup variant (one at a time, pinned to one core, rotating order). RSS stages read from /proc/self/status; the lookup-phase peak resets VmHWM through /proc/self/clear_refs after warm-up. Heap = mallinfo2 in-use bytes; database mapping residency from /proc/self/smaps.
Counters
CPU utilization = thread CPU time (RUSAGE_THREAD) / (wall time × workers). Core cycles per lookup = APERF delta via RDPRU on each pinned worker CPU / completed lookups. Cache-miss and branch-miss counters are unavailable (perf_event_paranoid = 4).
Validation: checksums identical across versions and repetitions: True · completed counts and zero errors: True · corpora identical between versions: True · ordered per-query differential digests identical on 8 corpora: True.
Limitations
Throughput covers IPv4 and IPv6, random addresses, lookup and lookup + decode, 10M queries, 1 and 2 threads on GeoLite2-City; latency covers IPv4 and IPv6, random addresses, lookup, 10M queries, 1 and 2 threads, with 5 repetitions per version and configuration. The Synthetic mixed fixture and populated-network workloads only enter the differential, memory, startup and allocation measurements.
GitHub-hosted runner: a virtual machine on shared cloud hardware, not an isolated benchmark host. Other tenants of the physical host and the runner's own processes kept running (largest mean consumers: Runner.Worker (0%), provjobd4117846 (0%), python3 (0%), Runner.Listener (0%), hv_kvp_daemon (0%)), and the guest's core topology need not match the physical one. Alternating order, per-repetition warm-up and 5 repetitions limit, but do not remove, their effect; 2-worker runs occupy every physical core and are the most exposed.
SMT stays enabled. CPU frequency is not visible from this machine (no cpufreq interface). Single-thread results run on the first allowed CPU.
Latency percentiles describe sampled operations (one in sixteen) and include the timer-read overhead; the maximum is the largest sampled value, not of every lookup.
GeoLite2-City is a real database (build 2026-10-30) that cannot be redistributed; the synthetic fixture is reproducible from benchmarks/harness/generate_synthetic_database.py but is not representative of commercial databases.
Uniformly random IPv6 addresses almost never match GeoLite2-City, so random IPv6 results mostly measure misses.
Results are specific to this x86-64 CPU, compiler and memory hierarchy; this report has no AArch64 or 32-bit measurements.
Some configurations show parallel efficiency above 100%: APERF cycles per lookup per worker decrease with more workers. The mechanism (for example memory and fabric power management at low load) was not isolated.
Cache-miss and branch-miss counters were unavailable; cycles per lookup come from APERF and include any interference on the pinned CPU.
The TSC-backed clock advances in steps of about 10 ns on this CPU (98.0% of latency samples fall on a 10 ns grid), so sub-50 ns latency percentiles are coarse.
Reproduction
# From the repository root. Needs Linux, GCC, Clang, CMake + Ninja, Autotools, OpenSSL headers,
# Python 3.11+, Node.js and Chrome. Builds both revisions, runs every campaign and the test suites, then
# regenerates benchmarks/reports; the measurements took 5 min on the machine above.
benchmarks/reproduce.sh /path/to/GeoLite2-City.mmdb   # build 2026-10-30, SHA-256 9e52c481…9d5563
# GitHub Actions measures x86-64 and AArch64 runners for every pushed benchmarks/* branch
# (.github/workflows/benchmarks.yml); this report comes from run 41200090568.
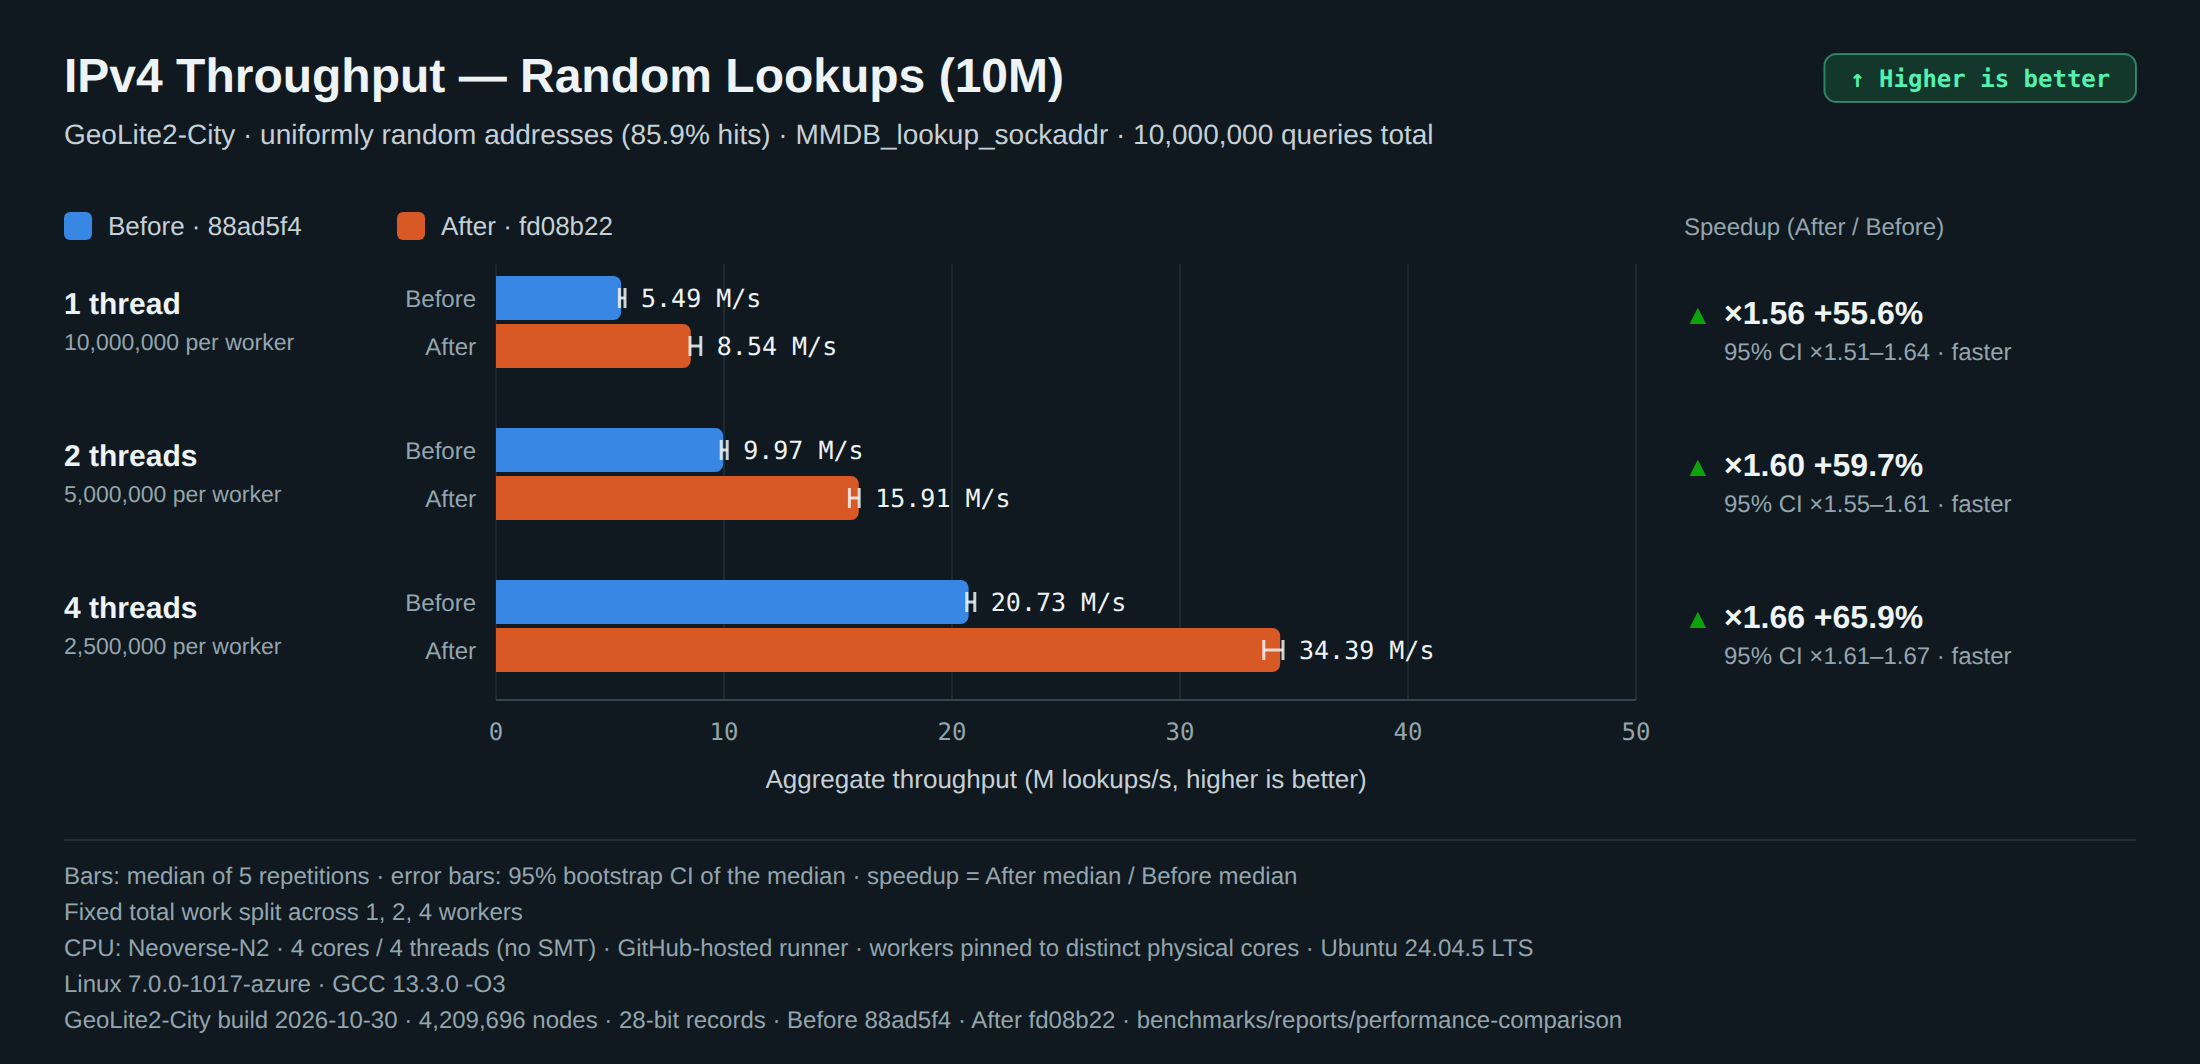
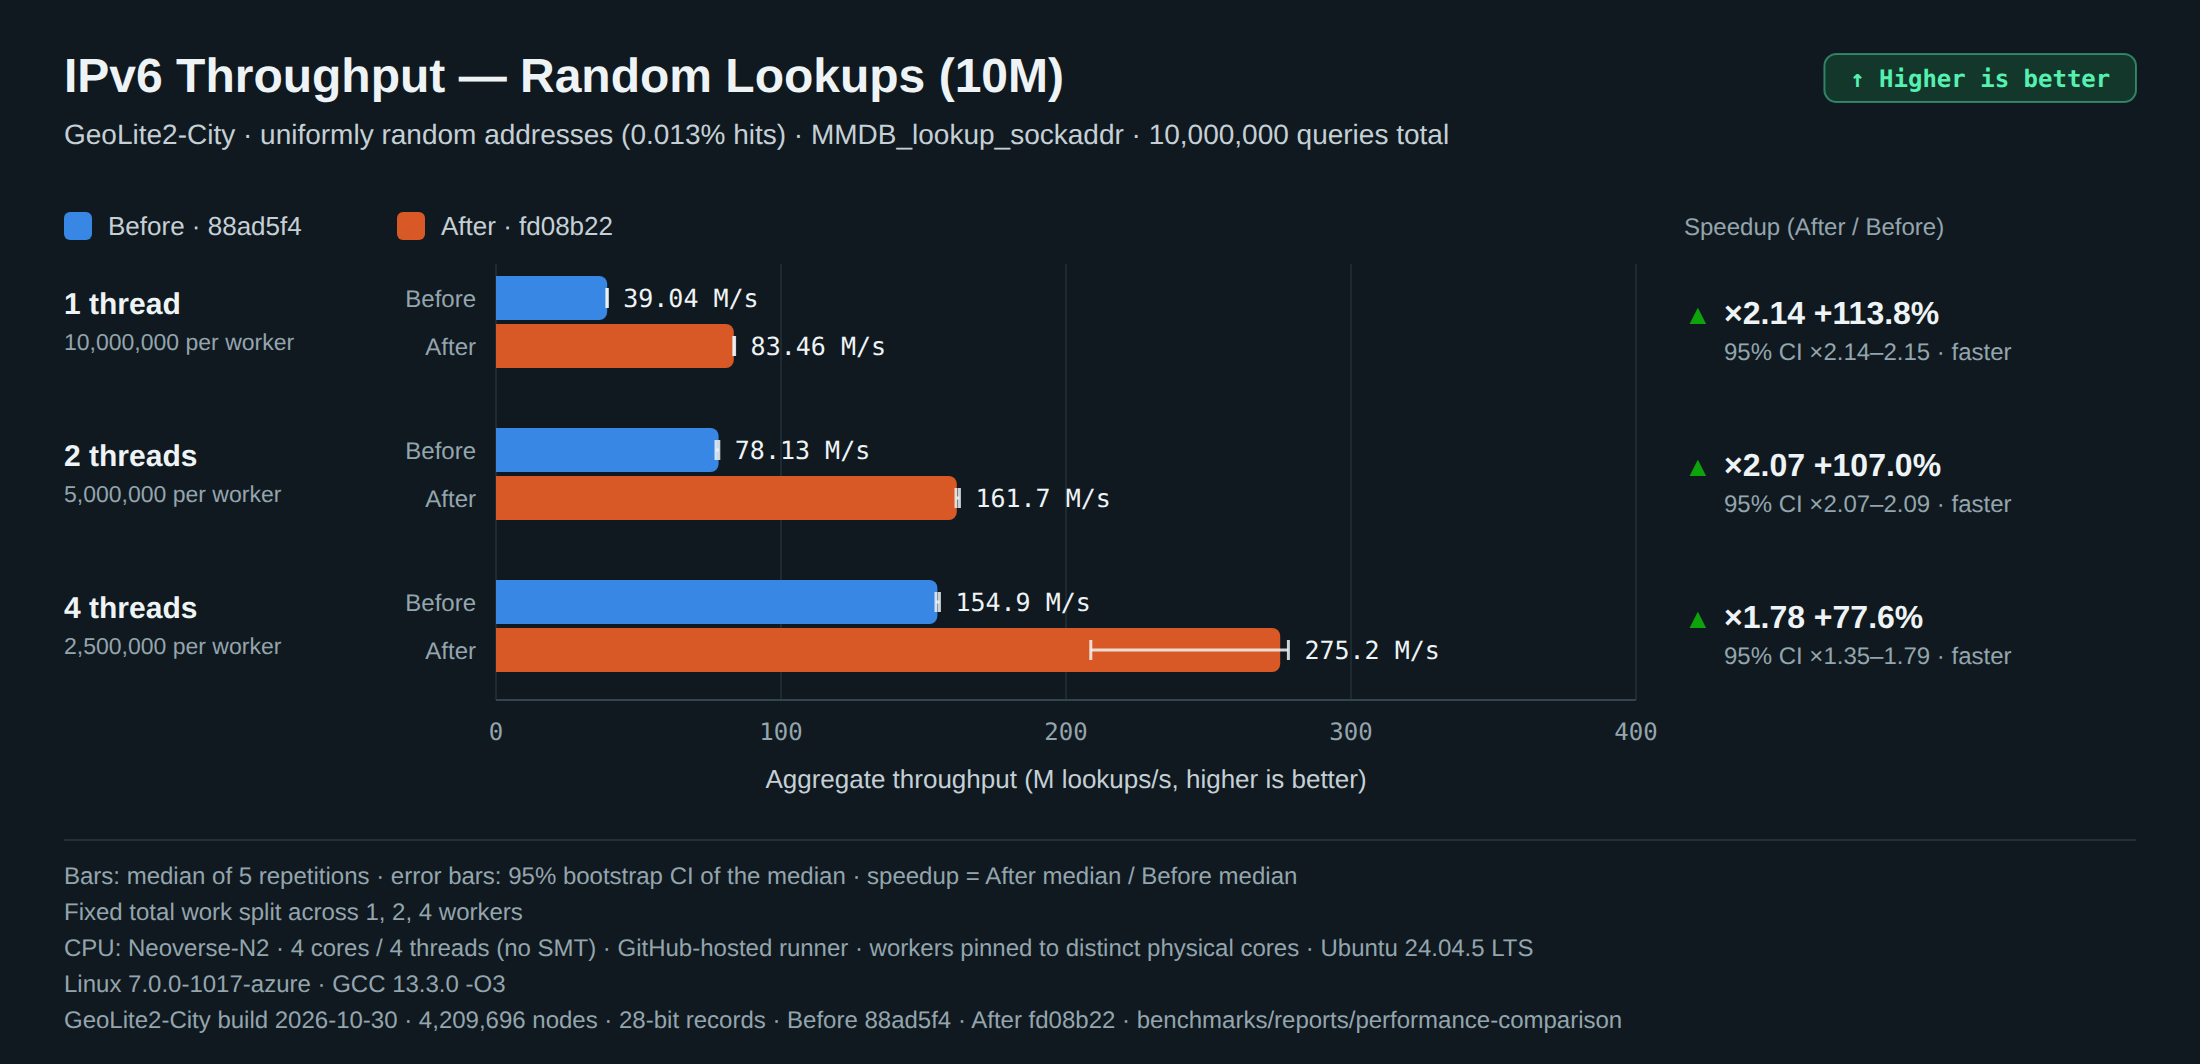
Total work is fixed: 1 worker performs 10,000,000 lookups, 2 workers 5,000,000 each, 4 workers 2,500,000 each.
IPv4 Throughput — Random Lookups (10M)
GeoLite2-City · uniformly random addresses (85.9% hits) · MMDB_lookup_sockaddr · 10,000,000 queries in total, split across 1, 2 and 4 pinned workers · median of 5 runs, 95% bootstrap CI
IPv4 Throughput — Random Lookups + Field Decode (10M)
GeoLite2-City · uniformly random addresses (85.9% hits) · MMDB_lookup_sockaddr + MMDB_get_value(country → iso_code) · 10,000,000 queries in total, split across 1, 2 and 4 pinned workers · median of 5 runs, 95% bootstrap CI
IPv6 Throughput — Random Lookups (10M)
GeoLite2-City · uniformly random addresses (0.013% hits) · MMDB_lookup_sockaddr · 10,000,000 queries in total, split across 1, 2 and 4 pinned workers · median of 5 runs, 95% bootstrap CI
IPv6 Throughput — Random Lookups + Field Decode (10M)
GeoLite2-City · uniformly random addresses (0.013% hits) · MMDB_lookup_sockaddr + MMDB_get_value(country → iso_code) · 10,000,000 queries in total, split across 1, 2 and 4 pinned workers · median of 5 runs, 95% bootstrap CI
Latency distribution
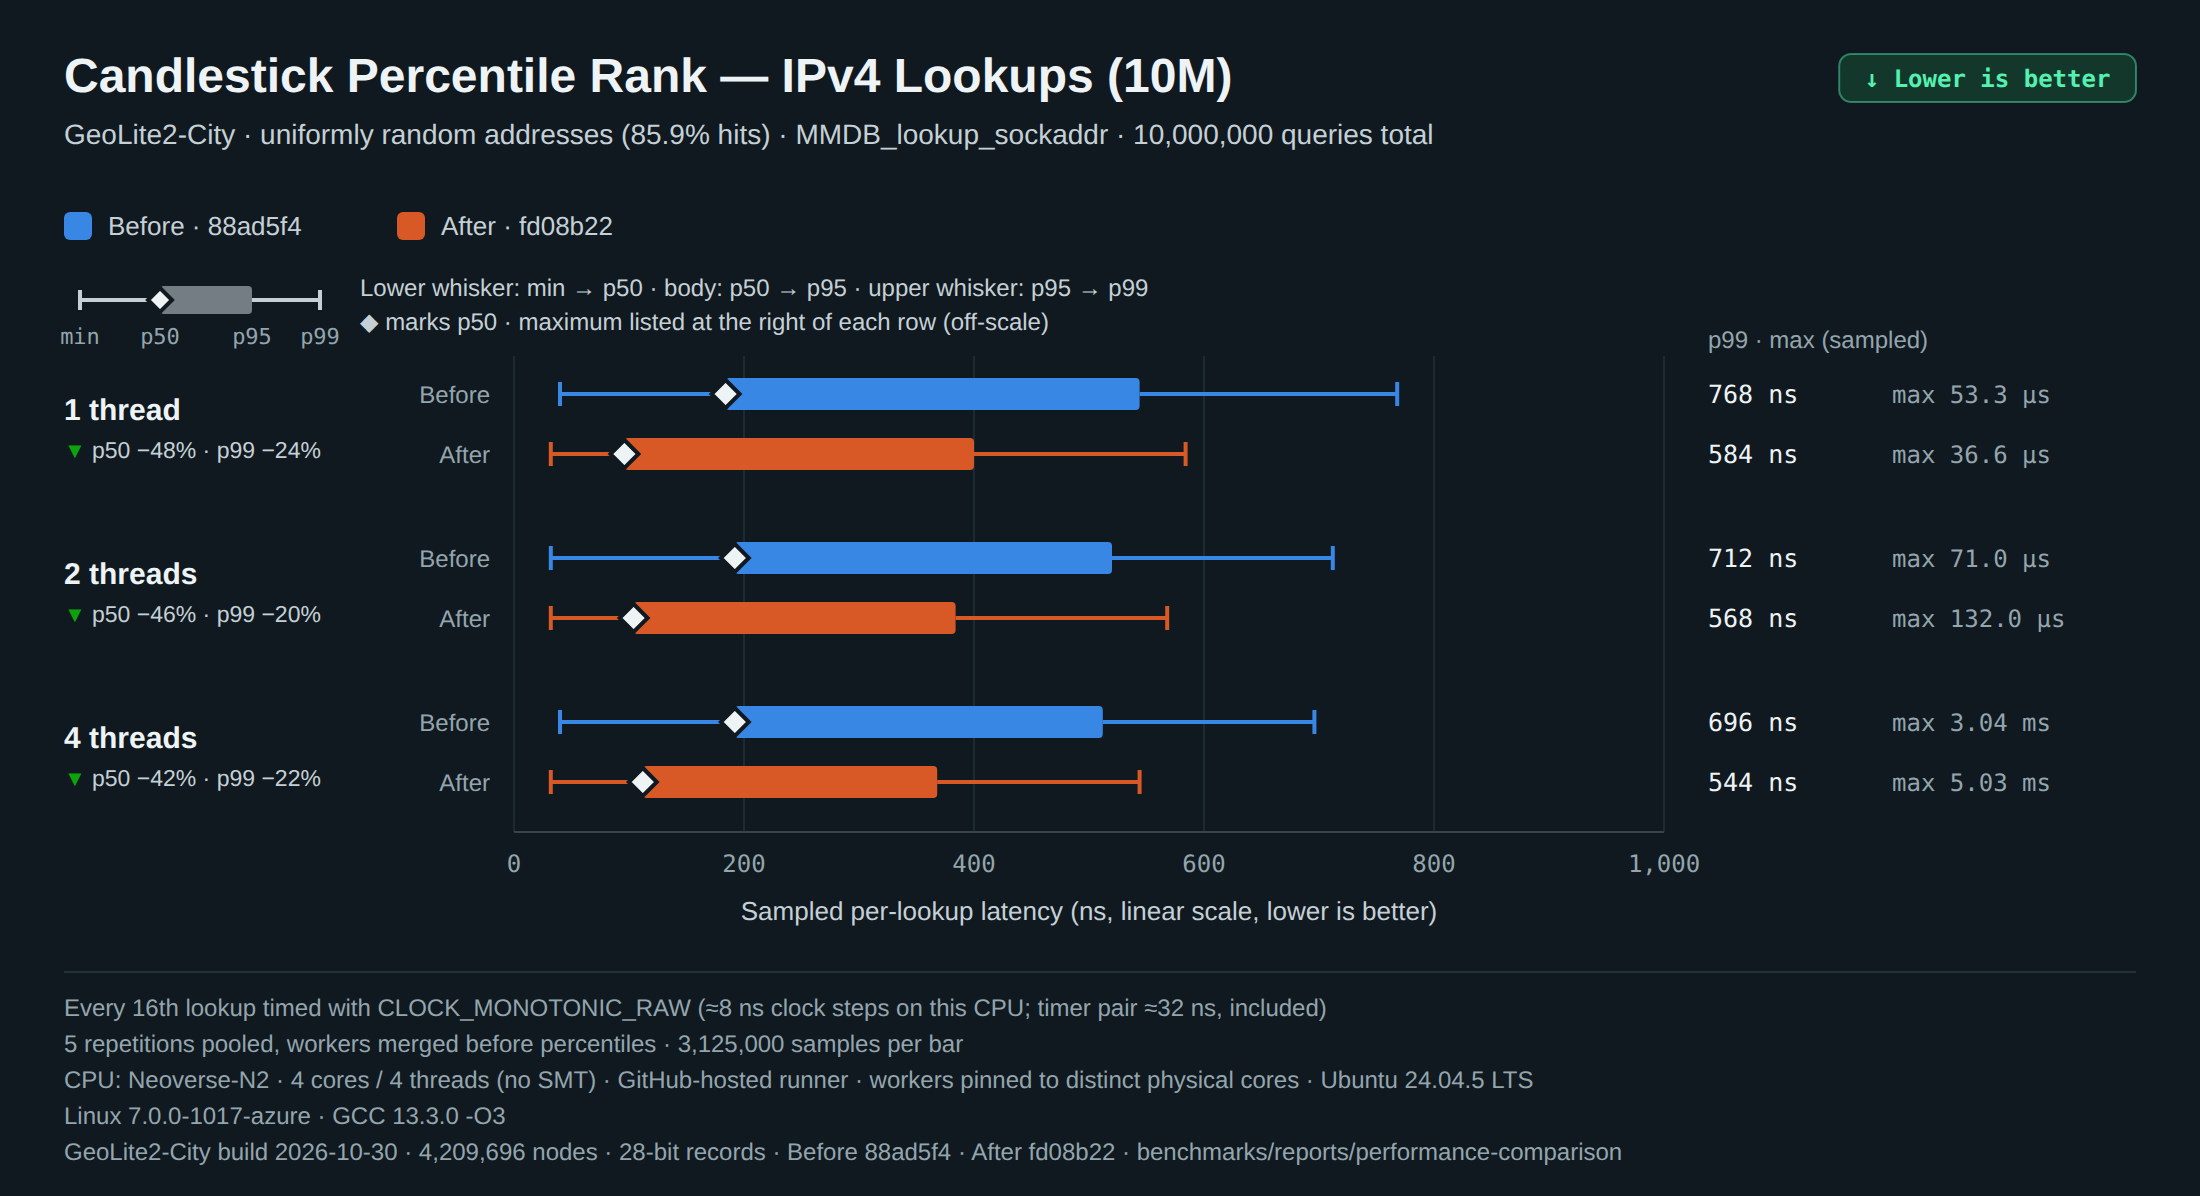
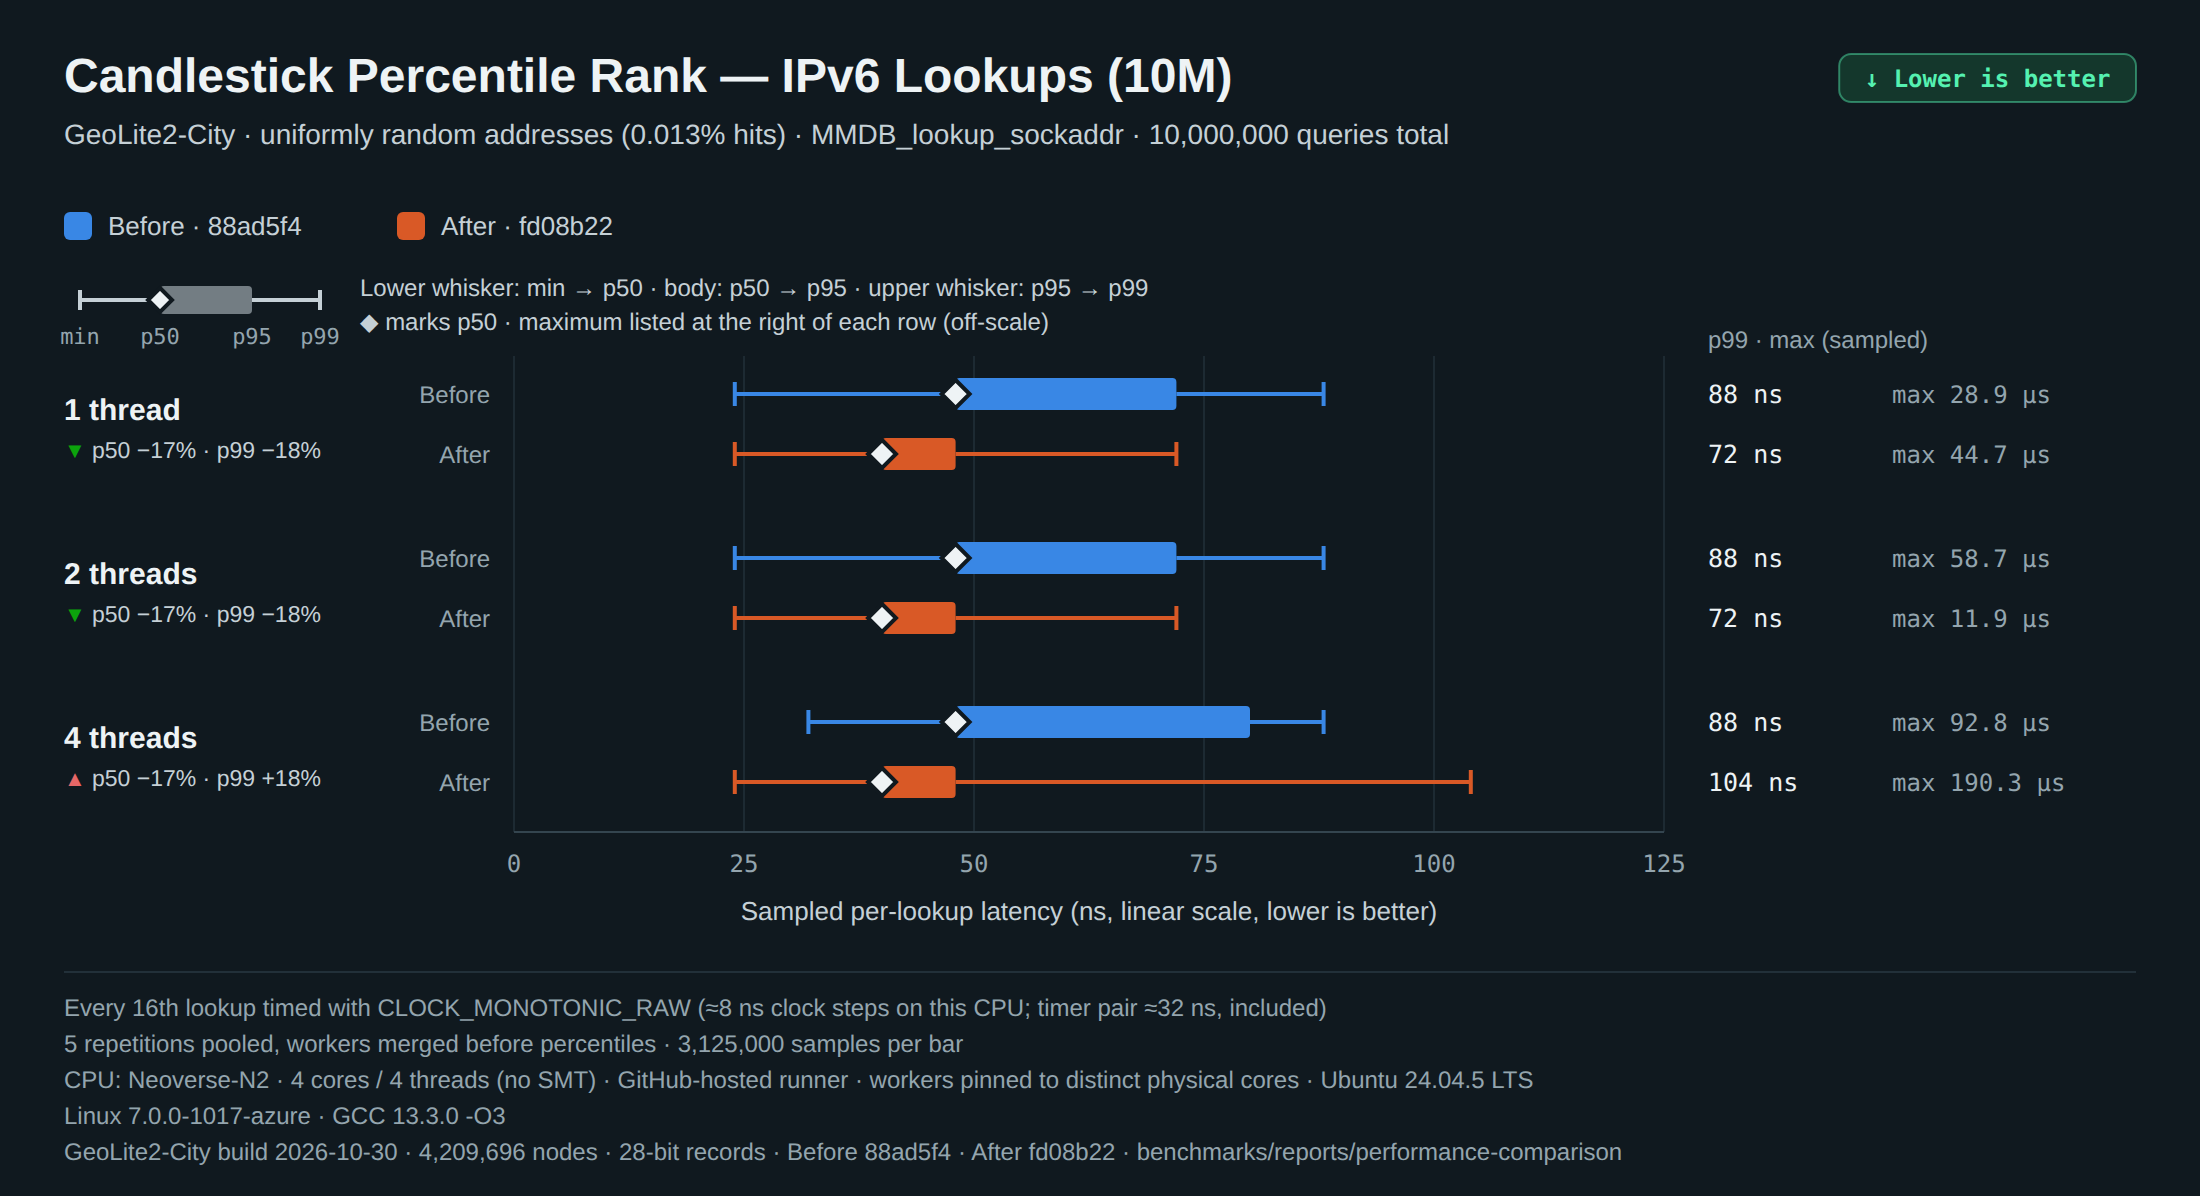
Separate latency campaign: one actual operation in every 16 is timed individually; workers are merged and repetitions pooled before percentiles are computed. Lower whisker min → p50, body p50 → p95, upper whisker p95 → p99, ◆ p50; the maximum is listed at the right of each row and in tooltips.
Candlestick Percentile Rank — IPv4 Lookups (10M)
GeoLite2-City · uniformly random addresses (85.9% hits) · MMDB_lookup_sockaddr · 10,000,000 queries in total · pooled samples of 5 repetitions per bar
Candlestick Percentile Rank — IPv6 Lookups (10M)
GeoLite2-City · uniformly random addresses (0.013% hits) · MMDB_lookup_sockaddr · 10,000,000 queries in total · pooled samples of 5 repetitions per bar
Thread scaling
Scaling = throughput(N) / throughput(1) of the same version; parallel efficiency = scaling / N × 100. Configurations that scale above 100% do so because the measured core cycles per lookup of each worker drop as workers are added (see the chart footers); the cause was not isolated.
Measured in fresh processes with the same preparation and warm-up as the throughput campaign. Process RSS is a whole-process metric; the library heap (mallinfo2 in-use bytes after MMDB_open) isolates reader and index allocations.
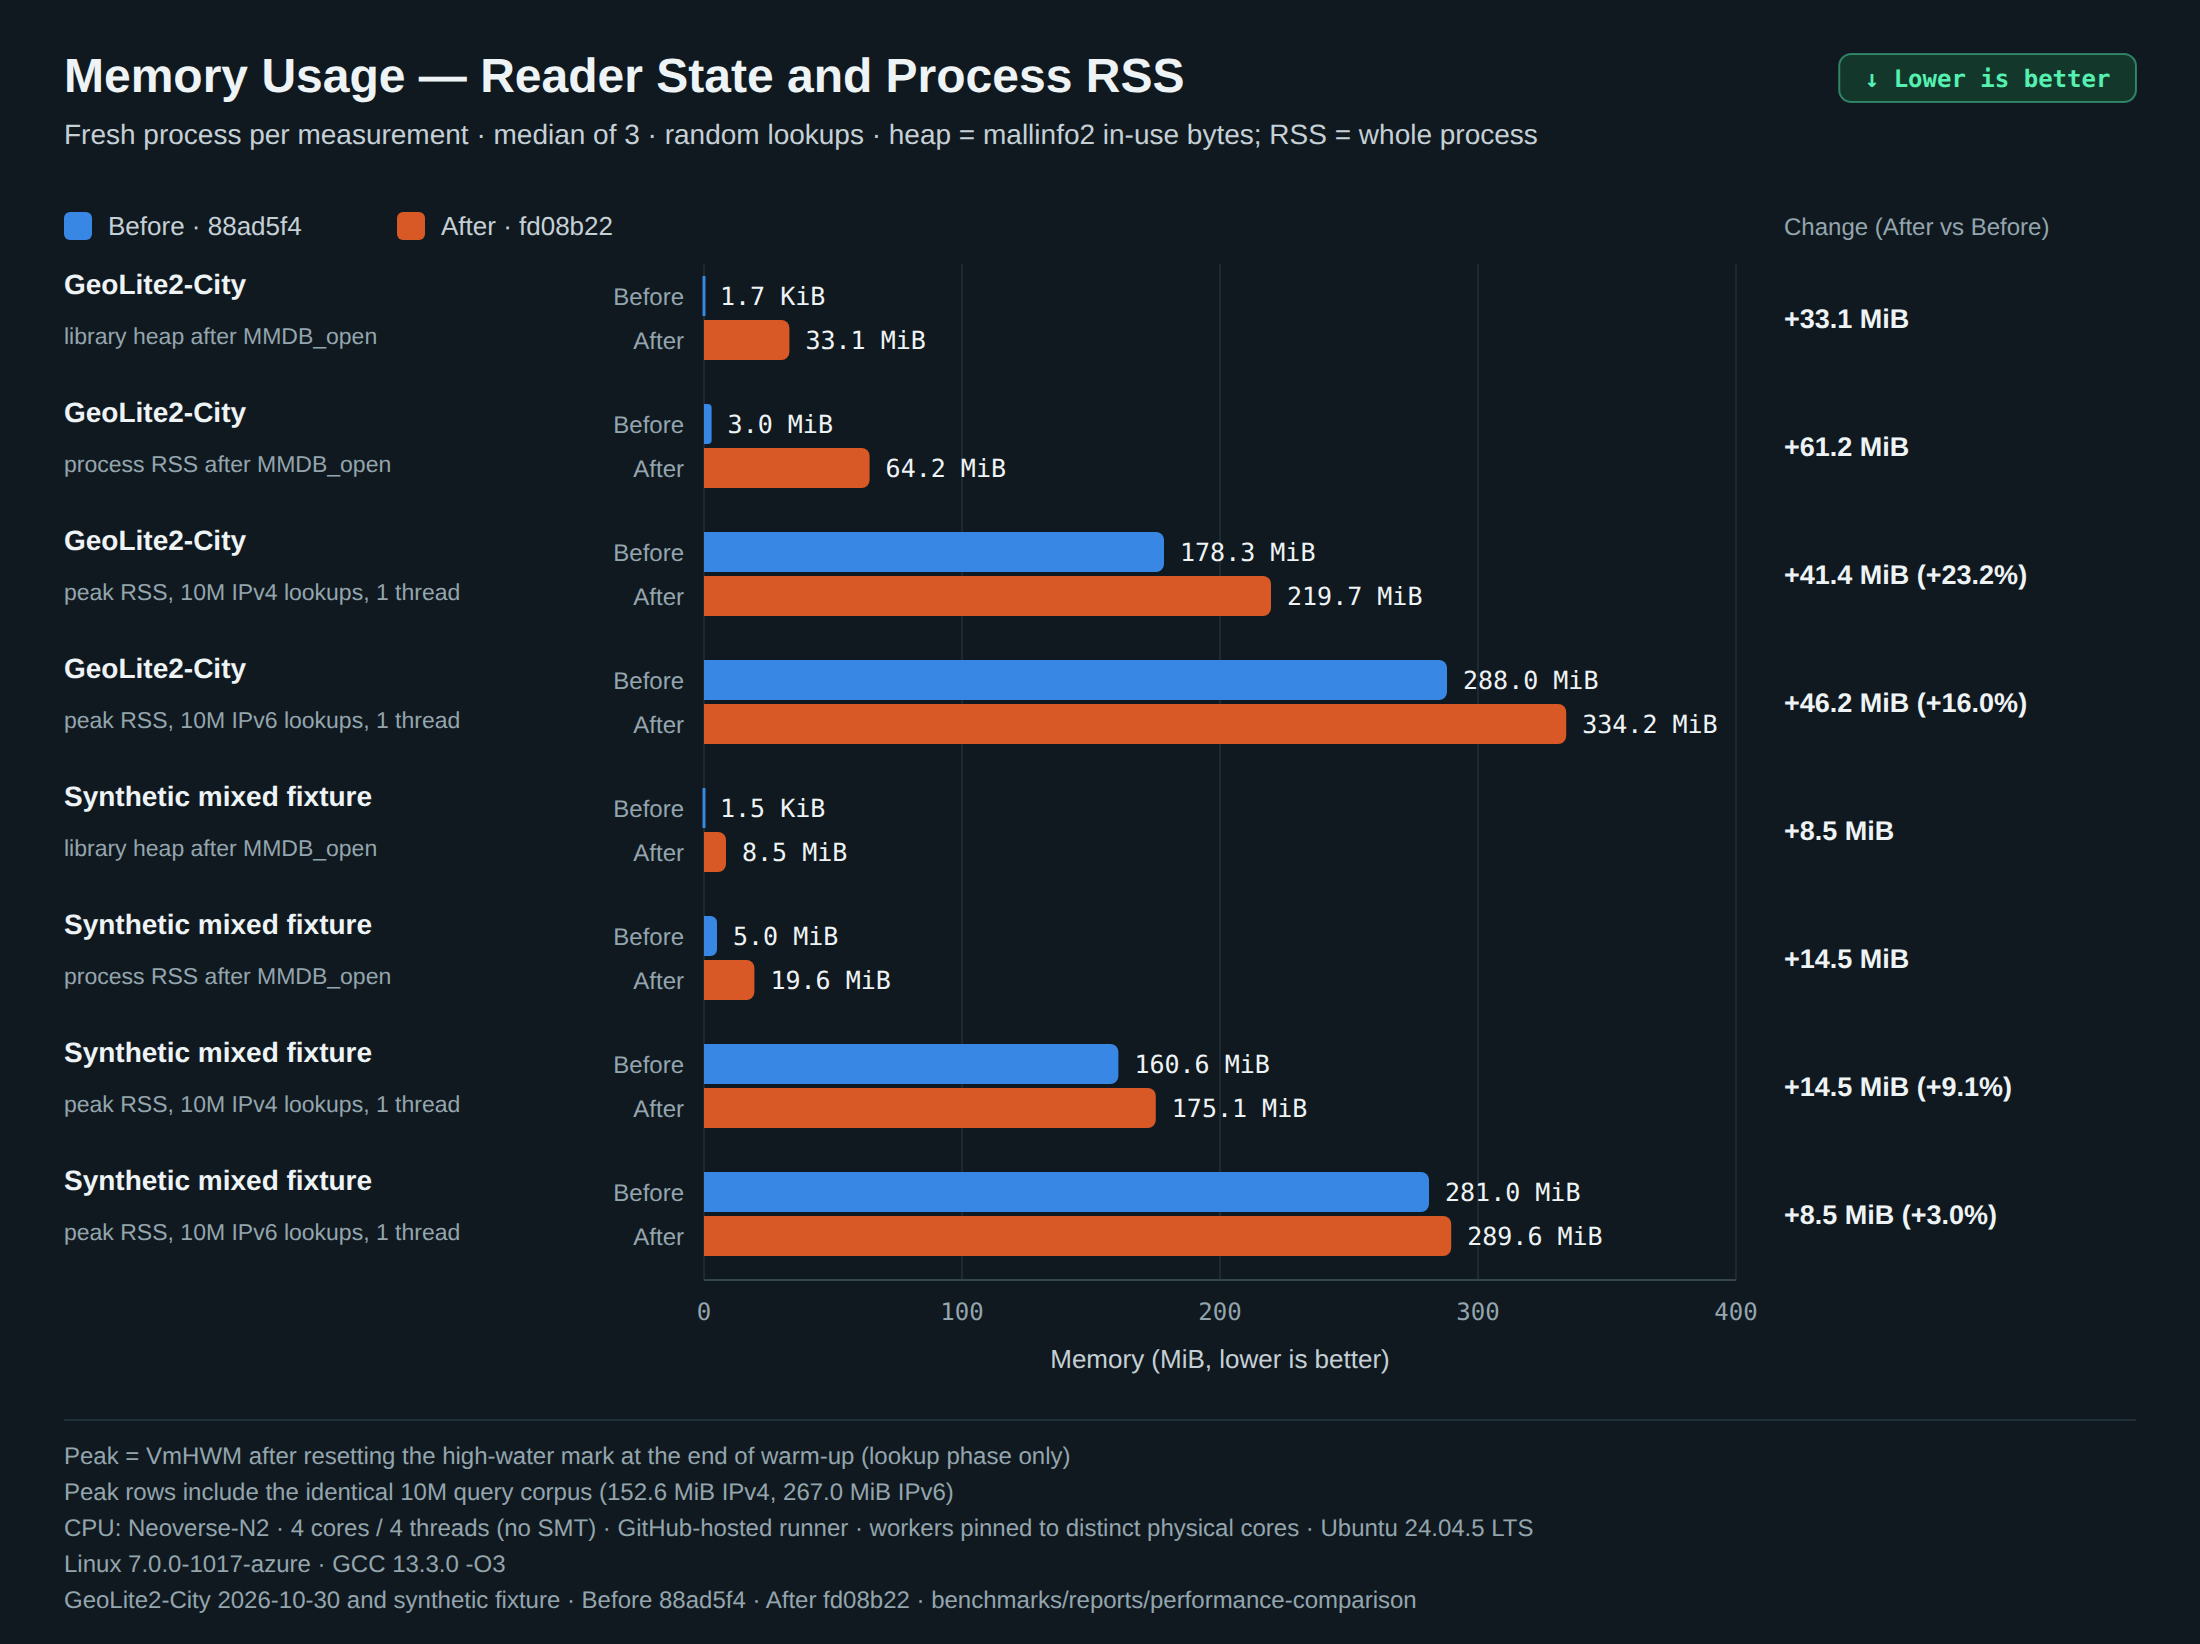
Memory Usage — Reader State and Process RSS
Fresh process per measurement, median of 3 · heap from mallinfo2 · RSS is whole-process
GeoLite2-City: library heap after MMDB_open 1.7 KiB → 33.1 MiB; process RSS after open 3.0 MiB → 64.2 MiB. Peak RSS during 10M-query lookups is shown with the identical query corpus included.
Startup and index preparation
After builds its native child array and 65,536-entry root tables inside MMDB_open; MMDB_NO_PREPARE skips that work. Opening time is measured separately from steady-state lookups.
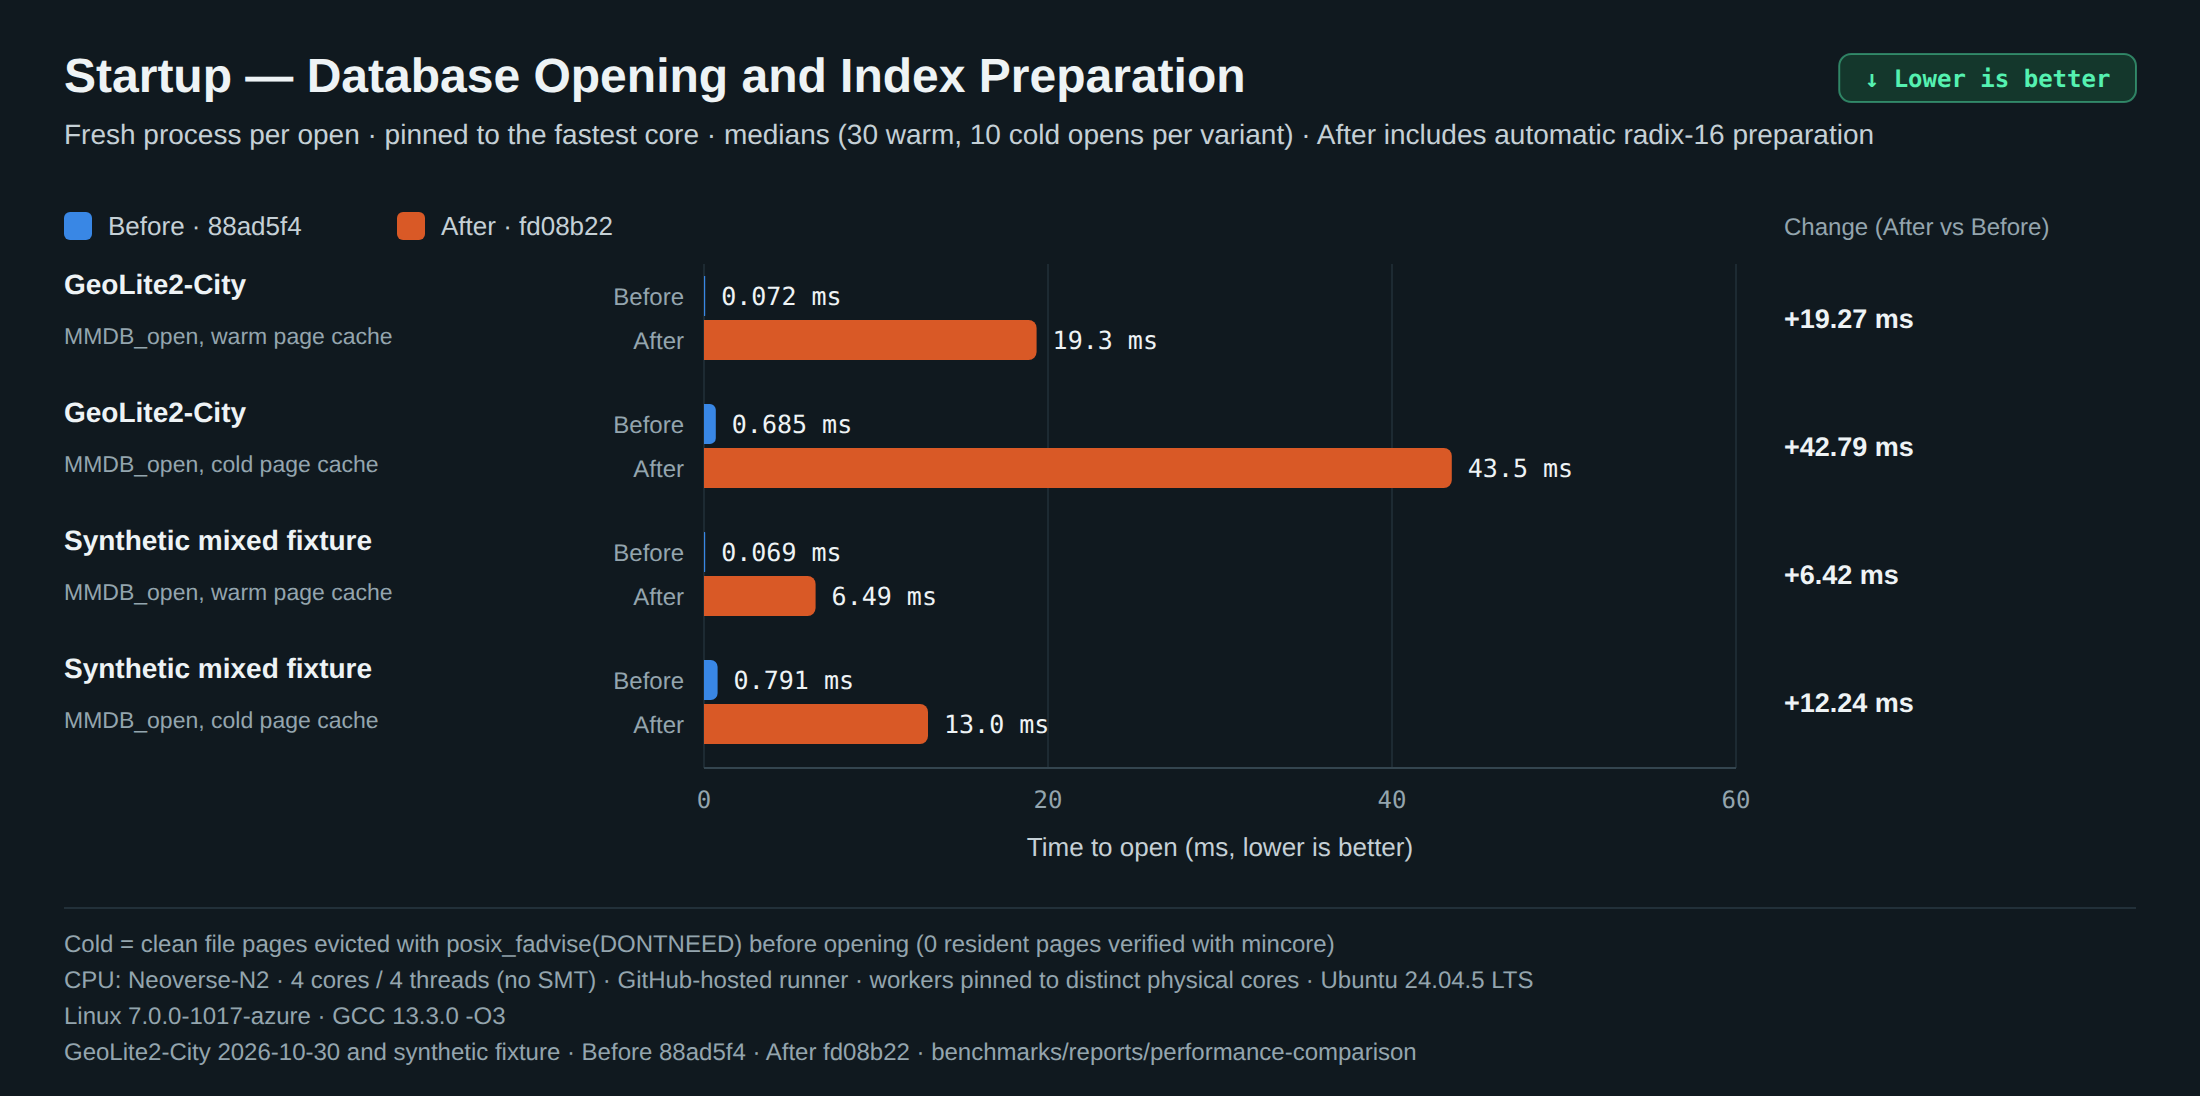
Startup — Database Opening and Index Preparation
Fresh process per open, pinned to one core · warm and cold page cache
MMDB_open on GeoLite2-City with a warm page cache: 0.072 ms → 19.3 ms (After prepares the native tree and radix-16 tables before returning).
Allocations
Heap Allocations per Lookup + Field Decode
Instrumented binaries only · measured lookup phase
Before allocates one temporary lookup-path array per MMDB_get_value call on a hit; After uses a stack buffer for paths of up to seven components and allocates nothing.
Every throughput configuration
Throughput Speedup Matrix — GeoLite2-City
Rows: family × profile × operation · columns: worker threads
Attribution between the traversal changes
A separate three-way campaign isolates the specialized packed traversal (After opened with MMDB_NO_PREPARE) from the automatic radix-16/native preparation, on identical corpora with 5 repetitions per variant in rotating order. Ratios are medians with 95% bootstrap intervals.
GeoLite2-City
IPv4
Random
10M
1
5.48
5.89
8.73
×1.07 [1.01–1.08]
×1.48 [1.46–1.58]
×1.59 [1.56–1.65]
GeoLite2-City
IPv4
Random
10M
4
20.89
22.64
35.38
×1.08 [1.05–1.11]
×1.56 [1.53–1.61]
×1.69 [1.64–1.73]
GeoLite2-City
IPv6
Random
10M
1
39.02
38.11
85.89
×0.98 [0.98–1.00]
×2.25 [2.25–2.26]
×2.20 [2.19–2.25]
GeoLite2-City
IPv6
Random
10M
4
155.3
151.8
336.6
×0.98 [0.98–1.14]
×2.22 [1.49–2.25]
×2.17 [1.45–2.52]
Result tables
Rows follow the filters above unless “show every configuration” is checked. Click a column header to sort.
GitHub-hosted runner; system CPU busy median 46.4% (p90 99.8%), load average median 2.50
Versions
Before 88ad5f46d9c884fc4a8533374b457cb9e3ee121f and After fd08b229052ae34e9f2c3c3df4f64ed9d43f4347, exported with git archive into isolated source trees (pinned submodules copied and verified). Static libraries built with CMake Release (-O3 -DNDEBUG) by the same GCC; the same bench.c links each archive. ldd shows no libmaxminddb shared object; symbol checks confirm which revision each binary contains.
Operations
lookup = MMDB_lookup_sockaddr on pre-built sockaddr structures (no text parsing in the timed loop). decode = lookup plus MMDB_get_value on hits (country → iso_code on GeoLite2-City, id on the synthetic fixture). Records without the field count as absent, identically in both versions.
Workloads
random: SplitMix64 (seed 0x6a09e667f3bcc909) over the whole IPv4 or IPv6 space. populated networks: every reachable data leaf is enumerated with MMDB_read_node, uniformly reservoir-sampled (2^20 networks), host bits randomized; IPv6 enumeration skips the IPv4 subtree and its aliases. Identical corpora (SHA-256 recorded) for both versions.
Throughput protocol
5 measured repetitions per configuration; one prepared process per version, triggered one repetition at a time, order alternating (even pairs Before first). Each repetition warms up with 1,000,000 queries in total, then workers pass a spin start gate. Throughput = completed lookups / wall-clock time from gate release to the last worker finishing. Thread-local checksums, no shared counters, no per-query timers.
Latency protocol
Separate campaign. Every 16th operation is timed with two CLOCK_MONOTONIC_RAW reads (back-to-back pair: min 16 ns, median 32 ns, p99 32 ns; included, not subtracted). Exact integer-nanosecond histograms from all workers and repetitions are merged before nearest-rank percentiles floor((n − 1) · p).
Statistics
Medians with 95% percentile bootstrap intervals (10,000 resamples, seed 0xc0ffee3). A difference is conclusive only when the interval of the ratio of medians excludes 1. Geometric means weight every configuration equally.
Memory and startup
Fresh processes: 3 per memory configuration (several at once, each pinned to its own core; nothing is timed) and 30 warm and 10 cold opens per startup variant (one at a time, pinned to one core, rotating order). RSS stages read from /proc/self/status; the lookup-phase peak resets VmHWM through /proc/self/clear_refs after warm-up. Heap = mallinfo2 in-use bytes; database mapping residency from /proc/self/smaps.
Counters
CPU utilization = thread CPU time (RUSAGE_THREAD) / (wall time × workers). No cycle counter is readable from user space on this CPU, so cycles per lookup are not reported. Cache-miss and branch-miss counters are unavailable (perf_event_paranoid = 4).
Validation: checksums identical across versions and repetitions: True · completed counts and zero errors: True · corpora identical between versions: True · ordered per-query differential digests identical on 8 corpora: True.
Limitations
Throughput covers IPv4 and IPv6, random addresses, lookup and lookup + decode, 10M queries, 1, 2 and 4 threads on GeoLite2-City; latency covers IPv4 and IPv6, random addresses, lookup, 10M queries, 1, 2 and 4 threads, with 5 repetitions per version and configuration. The Synthetic mixed fixture and populated-network workloads only enter the differential, memory, startup and allocation measurements.
GitHub-hosted runner: a virtual machine on shared cloud hardware, not an isolated benchmark host. Other tenants of the physical host and the runner's own processes kept running (largest mean consumers: Runner.Worker (0%), python3 (0%), provjobd1004205 (0%), containerd (0%), Runner.Listener (0%)), and the guest's core topology need not match the physical one. Alternating order, per-repetition warm-up and 5 repetitions limit, but do not remove, their effect; 4-worker runs occupy every physical core and are the most exposed.
CPU frequency is not visible from this machine (no cpufreq interface). Single-thread results run on the first allowed CPU.
Latency percentiles describe sampled operations (one in sixteen) and include the timer-read overhead; the maximum is the largest sampled value, not of every lookup.
GeoLite2-City is a real database (build 2026-10-30) that cannot be redistributed; the synthetic fixture is reproducible from benchmarks/harness/generate_synthetic_database.py but is not representative of commercial databases.
Uniformly random IPv6 addresses almost never match GeoLite2-City, so random IPv6 results mostly measure misses.
Results are specific to this AArch64 CPU, compiler and memory hierarchy; this report has no x86-64 or 32-bit measurements.
Some configurations show parallel efficiency above 100%. The mechanism was not isolated; no cycle counter was available to check whether per-lookup cost changes with the number of workers.
Cycle, cache-miss and branch-miss counters were unavailable; only wall-clock and thread CPU time were measured.
The Arm generic timer advances in steps of about 8 ns on this CPU (100.0% of latency samples fall on a 8 ns grid), so sub-40 ns latency percentiles are coarse.
Reproduction
# From the repository root. Needs Linux, GCC, Clang, CMake + Ninja, Autotools, OpenSSL headers,
# Python 3.11+, Node.js and Chrome. Builds both revisions, runs every campaign and the test suites, then
# regenerates benchmarks/reports; the measurements took 4 min on the machine above.
benchmarks/reproduce.sh /path/to/GeoLite2-City.mmdb   # build 2026-10-30, SHA-256 9e52c481…9d5563
# GitHub Actions measures x86-64 and AArch64 runners for every pushed benchmarks/* branch
# (.github/workflows/benchmarks.yml); this report comes from run 41200090568.